Two indicators are telling me the euro will bounce at 1.05
Long-term charts can be very handy when it comes to working out where a currency is heading. John C Burford explains.
Get the latest financial news, insights and expert analysis from our award-winning MoneyWeek team, to help you understand what really matters when it comes to your finances.
You are now subscribed
Your newsletter sign-up was successful
Want to add more newsletters?

Twice daily
MoneyWeek
Get the latest financial news, insights and expert analysis from our award-winning MoneyWeek team, to help you understand what really matters when it comes to your finances.

Four times a week
Look After My Bills
Sign up to our free money-saving newsletter, filled with the latest news and expert advice to help you find the best tips and deals for managing your bills. Start saving today!
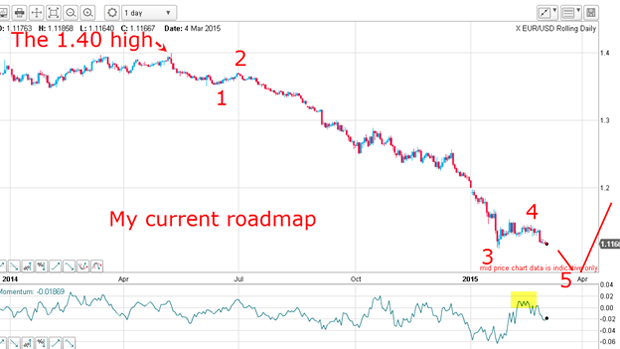
Since I wrote Wednesday's post, the euro has crashed below my wave 3 low at 1.11, and confirmed my Elliott wave count:

The market is now well and truly in a final fifth wave. But how low can it stretch?
There is one little-known feature of a classic motive five-wave pattern: in a genuine, extensive third wave, such as we have here, the waves start out from a high as bulls start to become disenchanted with their position and abandon their trades.
MoneyWeek
Subscribe to MoneyWeek today and get your first six magazine issues absolutely FREE

Sign up to Money Morning
Don't miss the latest investment and personal finances news, market analysis, plus money-saving tips with our free twice-daily newsletter
Don't miss the latest investment and personal finances news, market analysis, plus money-saving tips with our free twice-daily newsletter
Remember, near the 1.40 high, bullish sentiment was dominant; as the market started to drop, this degree of bullishness was only reduced gradually as more bullish traders realised they were on the wrong side of the market.
As the third wave got into gear in the summer, the decline became steeper (JulySeptember 2014 period). The bulls and the bears were becoming more evenly matched.
By September, however, bullish sentiment was a mere fraction of that at the top and the market became choppier with large rallies.
When the penny dropped, so did the markets
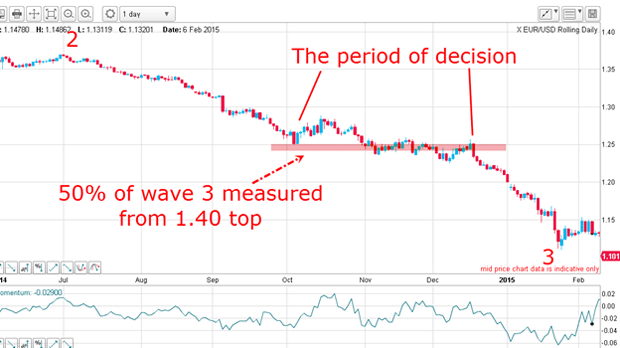
I call that the period of decision' and it usually occurs about half way along wave 3 as measured from the top.
If you look closely, you will find that the choppy period of decision does indeed lie about half way along wave 3:

Halfway down wave 3, the market is darting up and down in wider swings than before, or after. This shows the market is unsure about direction and it took about two and a half months to make up its mind. This was a very tricky period in which to trade.
When traders finally made up their collective mind, the market went hard down to the wave 3 low in January.
That help explains my wave 3 low at 1.11.
How long will the euro keep falling?
Let's go back to the very long-term chart for possible clues:

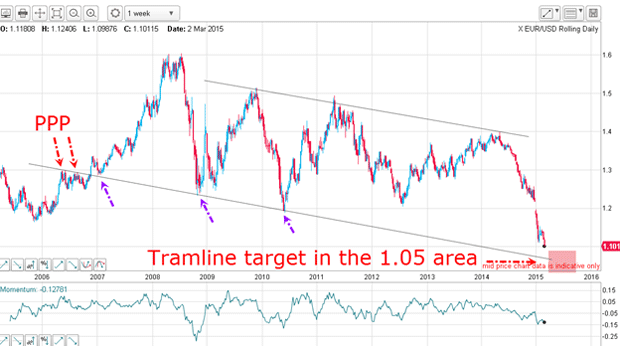
This is a very interesting chart. I have drawn in a tramline pair stretching over many years, and it is the lower tramline that grabs my attention.
I have a pair of prior pivot points (PPPs) and three highly accurate touch points (purple arrows). Just admire how beautifully the PPPs and the lows line up precisely on the tramline over a period of almost nine years. This is utterly textbook.
So, where does the tramline project to? If the market does reach the lower tramline in the final fifth wave, it will hit the 1.05 area. And if it overshoots, it could come close to the magic level of parity.
There is another very interesting feature of this long-range chart. Notice the gap at the start of the year; it is a breakaway gap, a well-established feature in classical charting (though rare in today's 24-hour markets).
Breakaway gaps usually occur about half-way along a trend. So, if we measure from the 1.40 high to the mid-point of the gap at around 1.22, that projects a target around 1.04 very close to the 1.05 tramline target.
I've two independent targets at the 1.04 1.05 area. How very interesting!
Get the latest financial news, insights and expert analysis from our award-winning MoneyWeek team, to help you understand what really matters when it comes to your finances.
John is is a British-born lapsed PhD physicist, who previously worked for Nasa on the Mars exploration team. He is a former commodity trading advisor with the US Commodities Futures Trading Commission, and worked in a boutique futures house in California in the 1980s.
He was a partner in one of the first futures newsletter advisory services, based in Washington DC, specialising in pork bellies and currencies. John is primarily a chart-reading trader, having cut his trading teeth in the days before PCs.
As well as his work in the financial world, he has launched, run and sold several 'real' businesses producing 'real' products.
-
 How a ‘great view’ from your home can boost its value by 35%
A house that comes with a picturesque backdrop could add tens of thousands of pounds to its asking price – but how does each region compare?
-
 What is a care fees annuity and how much does it cost?
How we will be cared for in our later years – and how much we are willing to pay for it – are conversations best had as early as possible. One option to cover the cost is a care fees annuity. We look at the pros and cons.