Trading multiple currencies using tramlines – continued
You won't always get your chart analysis right on the first attempt, says John C Burford. Here's what to do when your trading isn't going to plan.
Get the latest financial news, insights and expert analysis from our award-winning MoneyWeek team, to help you understand what really matters when it comes to your finances.
You are now subscribed
Your newsletter sign-up was successful
Want to add more newsletters?

Twice daily
MoneyWeek
Get the latest financial news, insights and expert analysis from our award-winning MoneyWeek team, to help you understand what really matters when it comes to your finances.

Four times a week
Look After My Bills
Sign up to our free money-saving newsletter, filled with the latest news and expert advice to help you find the best tips and deals for managing your bills. Start saving today!
I will follow up on Friday's post today, because we are being offered a fairly common problem that arises when trading with tramlines the case of an overshoot. It's important to know how to handle overshoots. I'll give you a clue: sometimes, your first tramline placing just isn't good enough.
EUR/USD
Normally, you would expect the market to kiss the line and then move lower in a 'scalded cat bounce'. That is the ideal scenario.
But later on Friday, the market rallied to the underside of the line alright but then kept on going to trade inside the trading channel again.
MoneyWeek
Subscribe to MoneyWeek today and get your first six magazine issues absolutely FREE

Sign up to Money Morning
Don't miss the latest investment and personal finances news, market analysis, plus money-saving tips with our free twice-daily newsletter
Don't miss the latest investment and personal finances news, market analysis, plus money-saving tips with our free twice-daily newsletter
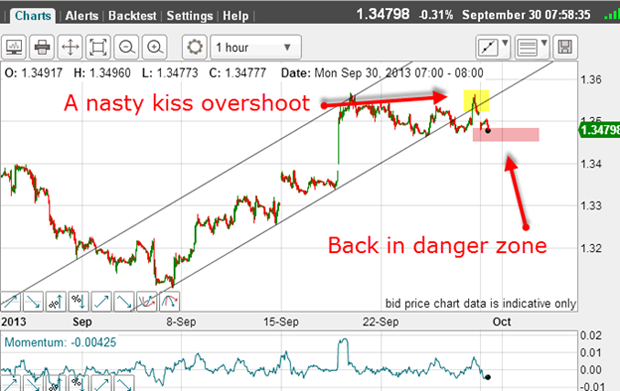
This overshoot would likely have resulted in protective buy-stops being triggered on short trades, which were taken on the tramline break.
However, this kind of action, where there is no clear-cut break away from the tramline, is not uncommon. And when this happens, the trader must start to question their tramline placement.
In order to do so, we have one more tool that will help us determine if the rally has exhausted, and to position short. It's known as the Elliott wave count.
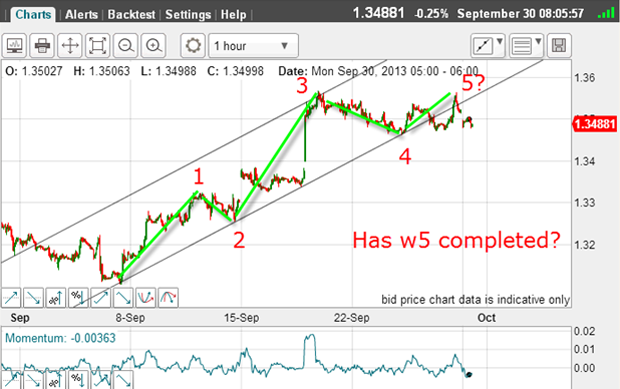
Here are the waves off the 6 September low and I have an extended wave 1 (w1) and a strong wave 3. Then, on Friday, the market rallied to within pips of the wave 3 high.
That would be enough to call the Friday high as the wave 5 high. If so, then the next move is down.
But the kiss overshoot is unsatisfactory, which prompts me to search for a better tramline pair and this is what I come up with:
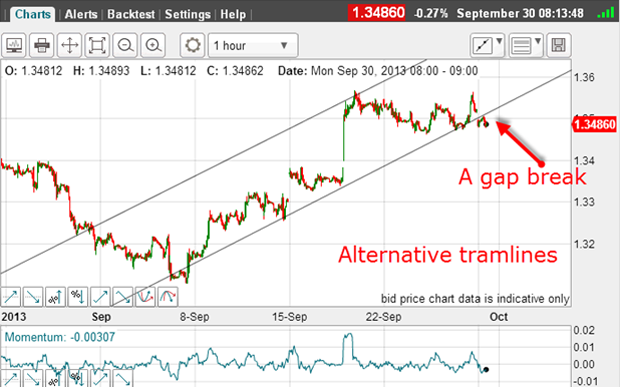
A slight adjustment can make a big difference
This looks better! I have now eliminated the kiss overshoot and this morning, the market has made a lower tramline break with a gap opening, and a small kiss in overnight trading, and now a move back down.
We could see a small rally back to the tramline in another kiss, but for now, the immediate outlook is bearish.
Finally, what does the close-up picture tell me?
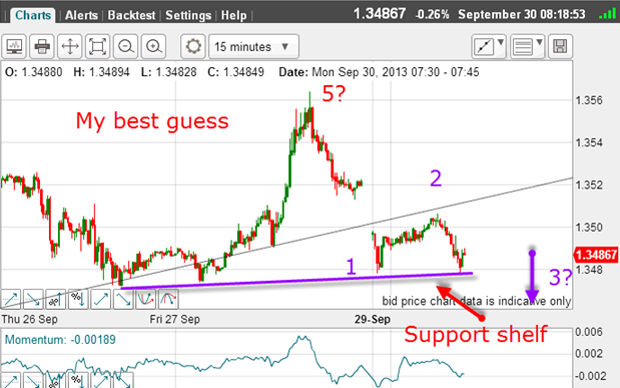
The decline off the Friday wave 5 high appears impulsive with wave 1 down and w ave 2 up. As I write, the market is testing the support shelf connecting recent lows.
A break here with a solid down move would set up the probability that wave 3 was in progress, taking the market to much lower levels.
The key is a possible break of the 1.3460 1.3480 level.
And the latest commitments of traders (COT) data is revealing:
| (Contracts of EUR 125,000) | Row 0 - Cell 1 | Row 0 - Cell 2 | Row 0 - Cell 3 | Open interest: 254,464 | ||||
| Commitments | ||||||||
| 129,862 | 64,018 | 3,662 | 72,759 | 138,915 | 206,283 | 206,595 | 48,181 | 47,869 |
| Changes from 09/17/13 (Change in open interest: 36,200) | ||||||||
| 28,899 | -5,038 | 115 | -1,131 | 44,559 | 27,883 | 39,636 | 8,317 | -3,436 |
| Percent of open in terest for each category of traders | ||||||||
| 51.0 | 25.2 | 1.4 | 28.6 | 54.6 | 81.1 | 81.2 | 18.9 | 18.8 |
| Number of traders in each category (Total traders: 198) | ||||||||
| 49 | 67 | 13 | 45 | 52 | 102 | 124 | Row 8 - Cell 7 | Row 8 - Cell 8 |
For the week ending last Tuesday, hedge funds (non-commercials) and small traders (non-reportables) ramped up their long positions (while lifting shorts) by a very wide margin.
On the other side of those trades, the commercials added to their short positions by the same wide margin. The swings were very large, as speculators bet on the continued rise of the euro.
But as history has demonstrated time and time again, when speculative sentiment has swung too far to one side, major turns are likely.
And with the hedgies now two-to-one long, the bull case is less and less persuasive.
EUR/GBP
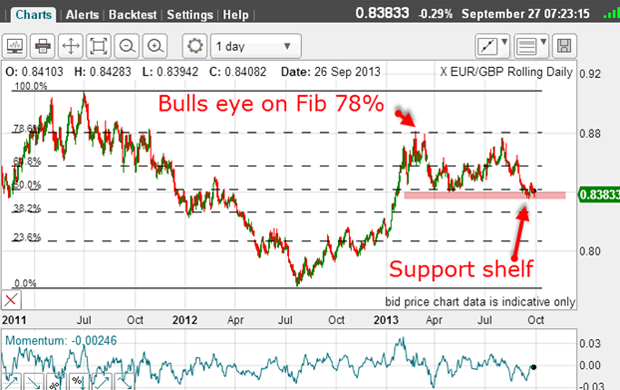
The market was testing the support shelf in the 8,400 area.
In overnight trading, it moved even deeper into this support:
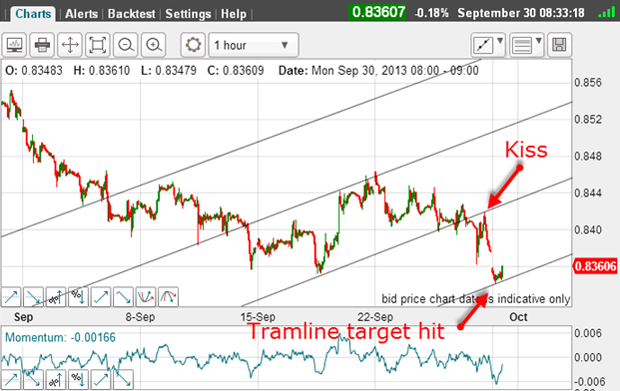
And my fourth tramline has just been hit with the gap opening this morning.
Remember, you can set third, fourth (and possibly more) tramlines to determine near-term targets, as I did here. They are most useful.
But with support giving way, the trend remains down.
USD/JPY
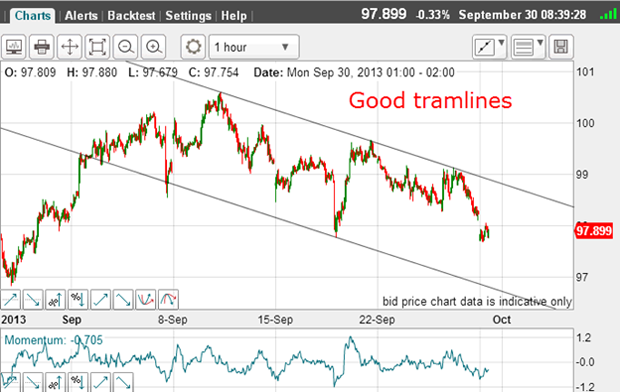
I have three superb touch points on the upper line. The lower line is of average quality with a PPP and one slight overshoot on the first touch point. These tramlines will be my working set for now.
And with speculators very long (COT data) in this market, the path of least resistance appears down.
In fact, the commercials (who are usually on the right side at major turns) are now almost nine-to-one short USD/JPY. I believe this is noteworthy!
The specs have bought into the continued depreciation of the yen, which was brought about by the Bank of Japan's QE (quantitative easing) programme. The commercials, on the other hand, don't buy it. This leaves me wondering: who will prevail?
Get the latest financial news, insights and expert analysis from our award-winning MoneyWeek team, to help you understand what really matters when it comes to your finances.
John is is a British-born lapsed PhD physicist, who previously worked for Nasa on the Mars exploration team. He is a former commodity trading advisor with the US Commodities Futures Trading Commission, and worked in a boutique futures house in California in the 1980s.
He was a partner in one of the first futures newsletter advisory services, based in Washington DC, specialising in pork bellies and currencies. John is primarily a chart-reading trader, having cut his trading teeth in the days before PCs.
As well as his work in the financial world, he has launched, run and sold several 'real' businesses producing 'real' products.
-
 Can mining stocks deliver golden gains?
With gold and silver prices having outperformed the stock markets last year, mining stocks can be an effective, if volatile, means of gaining exposure
-
 8 ways the ‘sandwich generation’ can protect wealth
People squeezed between caring for ageing parents and adult children or younger grandchildren – known as the ‘sandwich generation’ – are at risk of neglecting their own financial planning. Here’s how to protect yourself and your loved ones’ wealth.