Trading multiple currencies using tramlines
Relying on economic data as the basis for your currency trades is a risky strategy. John C Burford explains why detailed chart analysis is a better bet.
Get the latest financial news, insights and expert analysis from our award-winning MoneyWeek team, to help you understand what really matters when it comes to your finances.
You are now subscribed
Your newsletter sign-up was successful
Want to add more newsletters?

Twice daily
MoneyWeek
Get the latest financial news, insights and expert analysis from our award-winning MoneyWeek team, to help you understand what really matters when it comes to your finances.

Four times a week
Look After My Bills
Sign up to our free money-saving newsletter, filled with the latest news and expert advice to help you find the best tips and deals for managing your bills. Start saving today!
Many traders are guided in their currency trading by what is called the fundamentals. This is the news flow, which includes the regular economic reports issued by government bodies.
If one is trading the US dollar, for example, there is a huge amount of information available from GDP figures to trade balances, to jobless claims, and so on.
All of these inputs are thought to determine dollar exchange rates. That is the classic academic' view.
MoneyWeek
Subscribe to MoneyWeek today and get your first six magazine issues absolutely FREE

Sign up to Money Morning
Don't miss the latest investment and personal finances news, market analysis, plus money-saving tips with our free twice-daily newsletter
Don't miss the latest investment and personal finances news, market analysis, plus money-saving tips with our free twice-daily newsletter
But the problem is this: how do you balance an economic number on one side of the currency cross, say the jobless claims number, with the equivalent figure on the other?
Take the GBP/USD cross. Common sense would suggest that if, say, the jobless claims number for the US is improving, that should support the dollar. And the jobless number for Britain may be worsening, and that should put pressure on the GBP.
In this case, the GBP/USD rate should decline.
But this is not the whole story. Some other factor, like GDP figures, may be getting worse for the US and better for Britain. That would have the opposite effect.
And I have mentioned only three possible relevant inputs. The number of potential factors is more or less infinite.
The point of this kind of analysis is to arrive at a fair value of the exchange rate from the economic data. If the current market varies from your answer, then you have a trade.
One of the problems with this approach is that all of the data points are lagging. They are historic and may or may not bear any relationship with future activity.
The other major problem is that you have to come up with this number yourself, and the market may or may not agree with it.
I have found technical (chart) analysis to be the better approach while still keeping an eye on the macro picture. My tramline methods are particularly useful.
I will analyse the EUR/USD and GBP/USD markets using these methods, and then see how my analysis fits the EUR/GBP market.
EUR/USD
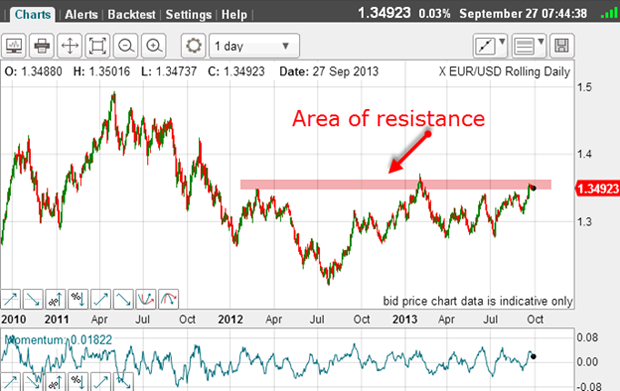
Since January the market has shown some wide swings with no clear long-term trend. The highs and lows have generally been accompanied by extreme sentiment levels. The latest sentiment picture shows high bullishness towards the euro, as traders recognise that the euro will survive.
It was not too long ago when the press was sure that the euro was doomed to collapse, as the peripheral economies faced depression. The belief was that the depressions would force the national governments to abandon the euro and revert to their old currencies.
But so far, the bail-outs (and one Cyprus bail-in) have done enough to stablilise their economies and that has given heart to the euro bulls.
On the other side, the US dollar has its own problems, with national debt still expanding, and the economy still just about keeping steady and with the assistance of continued QE (money printing) by the Fed.
But although that would appear bullish toward the euro, we know that when everyone thinks one way, the markets make their turns.
This is the picture as I see it: the market has made a 78% retrace of the big move up from the 1.28 lows. The move up from July has a clear A-B-C pattern, suggesting this is a counter-trend move and when wave C terminates, the next big move will be down.
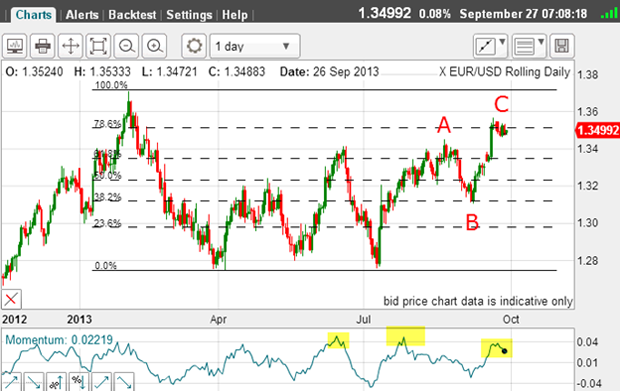
Let's now zoom in for a close-up:
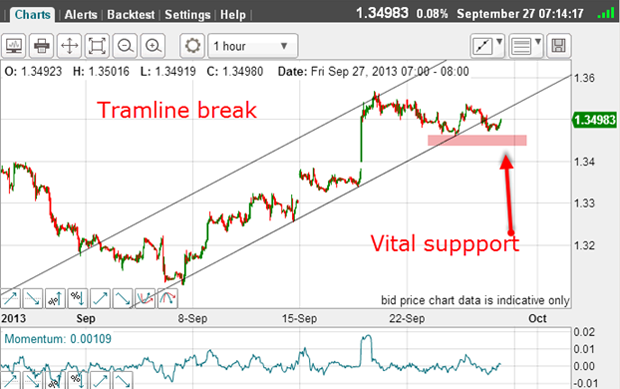
I have a superb tramline pair. The lower line has at least four touch points, and the upper line, although only having one touch point (the major high), has a lovely prior pivot point (PPP). It also has a slight overshoot similar to the one in the GBP/USD chart and with the same implications.
And yesterday, the market broke the lower tramline. That is a bearish signal, because according to the tramline trading rules a tramline break like this, following a big run, is a shorting signal.
This morning, the market is attempting a tramline kiss.
That is my first tramline pair.
GBP/USD
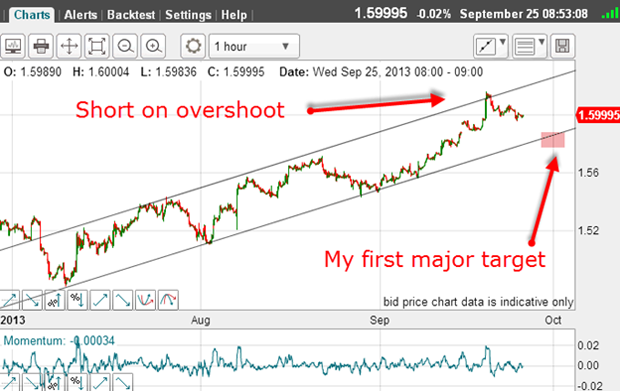
It shows my superb tramline pair (with upper PPP). It shows the overshoot above the upper tramline (giving an initial sell signal), and a price target at the lower tramline.
This is the current chart:
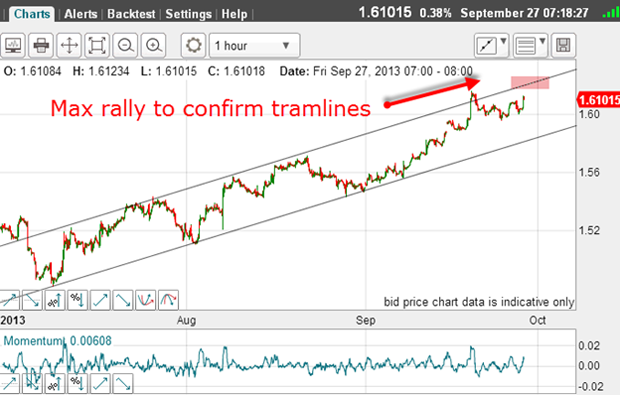
This morning's rally is still within the confines of the trading channel, but a sharp move above would cancel out my tramlines.
Meanwhile, I have a break-even stop on my short trade.
So while the GBP/USD gave a sell signal on the overshoot of the upper tramline, EUR/USD has been trading weaker and has broken its lower tramline.
This sets up the intriguing idea of a trade in EUR/GBP!
EUR/GBP
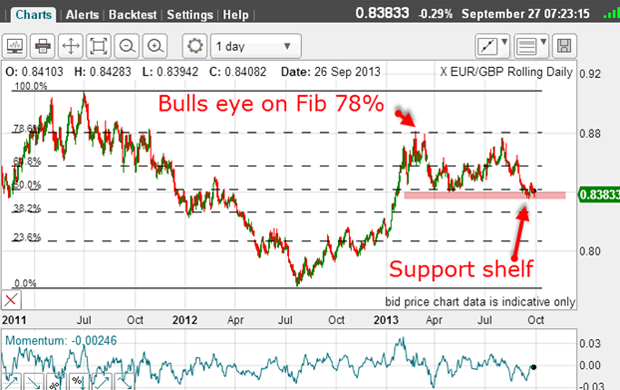
From the 2011 high, the market has declined to last summer's low and then rallied to the precise 78% Fibonacci retrace. That is very pretty.
Since then, it has been in a trading range, but now appears to be testing my support shelf. A break here would be bearish, of course.
Here is the latest action on the hourly chart:
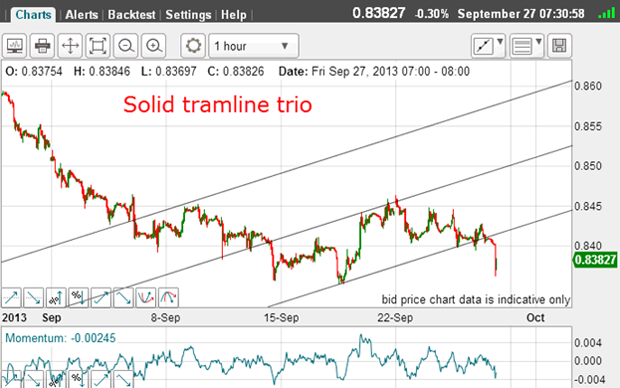
I have a lovely tramline trio the upper two lines have good PPPs and the lower one has just been broken in overnight trading.
This means my support shelf is in danger of being broken. The trend remains down.
And in currencies, the trend is usually your friend.
Get the latest financial news, insights and expert analysis from our award-winning MoneyWeek team, to help you understand what really matters when it comes to your finances.
John is is a British-born lapsed PhD physicist, who previously worked for Nasa on the Mars exploration team. He is a former commodity trading advisor with the US Commodities Futures Trading Commission, and worked in a boutique futures house in California in the 1980s.
He was a partner in one of the first futures newsletter advisory services, based in Washington DC, specialising in pork bellies and currencies. John is primarily a chart-reading trader, having cut his trading teeth in the days before PCs.
As well as his work in the financial world, he has launched, run and sold several 'real' businesses producing 'real' products.
-
 ISA fund and trust picks for every type of investor – which could work for you?
Whether you’re an ISA investor seeking reliable returns, looking to add a bit more risk to your portfolio or are new to investing, MoneyWeek asked the experts for funds and investment trusts you could consider in 2026
-
 The most popular fund sectors of 2025 as investor outflows continue
It was another difficult year for fund inflows but there are signs that investors are returning to the financial markets