If you’re trading gold, watch this chart
Everyone is watching this crucial gold chart with bated breath, says John C Burford. If the support line is broken, who knows how far gold will plummet?
Get the latest financial news, insights and expert analysis from our award-winning MoneyWeek team, to help you understand what really matters when it comes to your finances.
You are now subscribed
Your newsletter sign-up was successful
Want to add more newsletters?

Twice daily
MoneyWeek
Get the latest financial news, insights and expert analysis from our award-winning MoneyWeek team, to help you understand what really matters when it comes to your finances.

Four times a week
Look After My Bills
Sign up to our free money-saving newsletter, filled with the latest news and expert advice to help you find the best tips and deals for managing your bills. Start saving today!
Let's stick with gold. I get a lot of feedback from readers about gold and right now it's throwing up some thrilling moves.
Gold continues to be swung around by the intensifying battle between the two major opposing forces: debt deflation vs currency printing. So you can expect to see these big moves continue and some great trading opportunities too!
As I'll show you today, this market has reached a highly significant point on the charts. So let's get straight to it.
MoneyWeek
Subscribe to MoneyWeek today and get your first six magazine issues absolutely FREE

Sign up to Money Morning
Don't miss the latest investment and personal finances news, market analysis, plus money-saving tips with our free twice-daily newsletter
Don't miss the latest investment and personal finances news, market analysis, plus money-saving tips with our free twice-daily newsletter
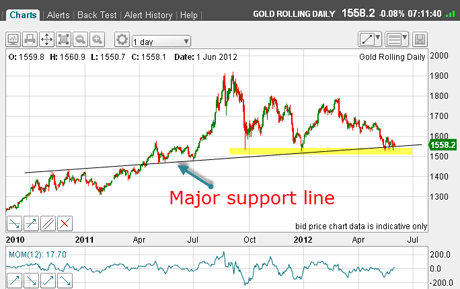
On Tuesday, I showed the long-range daily chart where I had identified a solid line of support and resistance acting over the past 18 months or so.
Major support gives way and gold plummets
Take a look at the updated chart:
(Click on the chart for a larger version)
As you can see, the market has been toying with both this line and the area around chart support (yellow bar). This is an area that has previously repelled declines.
As I pointed out on Tuesday, on the two previous occasions, there were sharp spikes down and then sharp recoveries. But not this time.
This may be significant. I'll show you why in a moment.
First, let me tell you how I traded this move
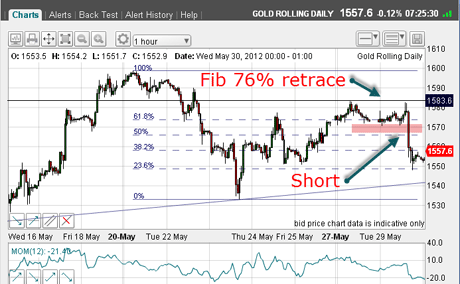
As you can see, the market rallied to the Fibonacci 76% retrace on Tuesday. Also note the A-B-C form to the rally off the $1,532 plunge low on Thursday (see chart on 29 May post).
Using both of these, I was able to place entry sell orders at the $1,580 area:
(Click on the chart for a larger version)
A possible secondary entry was in the area of the pink bar as the market fell below the minor dip.
How I limited my risk and picked an exit point
Long-time readers will know I always like to limit my risk. And in this case, my protective stop was placed just above the $1,590 level. That gave me a low-risk trade.
The market then made another leg down and I was then able to search for new tramlines for my target and possible exit.
And this is what I found on Wednesday:
(Click on the chart for a larger version)
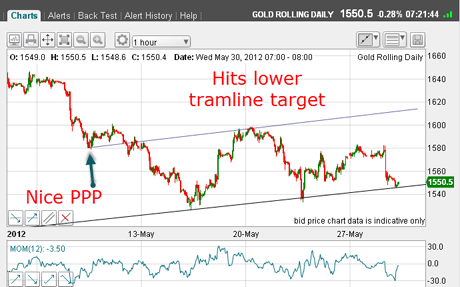
My upper tramline sports a nice prior pivot point and passes across the 20 May highs.
My lower tramline cuts right across the two major lows and now, the market is touching this line for a third time.
That was an opportunity to take a quick one-day profit. Remember, one of my tramline rules is to cover shorts on the lower tramline.
As you know, I've been bearish on gold for a long time, because I believe the forces of deflation will eventually win. So unless the market can prove to me that I'm wrong, I'll continue to look for shorting opportunities, such as this one.
As a swing trader, all I'm interested in is catching the up and down swings to make profits. I know I will miss many opportunities to make additional profits on some trades. That's what happened here because the market did break down below my lower tramline on Wednesday, and I missed another $20 on the downside.
Am I concerned I missed this? Of course not! I took a nice profit and I am relaxed as I look for another opportunity. Being relaxed is an important factor in trading success.
(Click on the chart for a larger version)
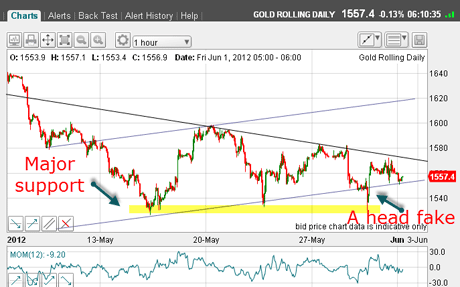
But see how the move below the tramline was quickly reversed as the chart support (yellow bar) proved too strong and a head fake' was in place. These are especially common on gold charts and can be nasty!
This wedge pattern looks interesting
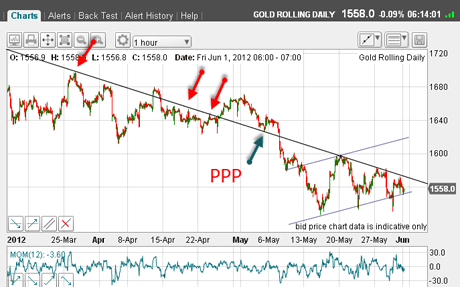
Now, though, the market is forming a nice wedge with the upper wedge line formed from connecting the recent major highs. But can I rely on this line? After all, I only have a few touch-points so far.
To verify, I need to back the chart up and see where the line reaches. And this is what I find:
(Click on the chart for a larger version)
I have a solid PPP and many touch points (red arrows) going back two months or so. That is pretty and reassuring.
As I write this morning, I see the market trading within my wedge, having been supported on Wednesday by chart and trendline support by the bounce off the $1,530 area.
Sooner or later, the market will move out of the wedge and it could be a big move but which way?
A move above my upper wedge line could be very exciting. Why? Simply because market sentiment has swung from manic bullishness to a much more bearish cast (see the COT chart in Tuesday's post).
These new-found bears will have their protective stops at the region of the minor highs and there could be lots of them!
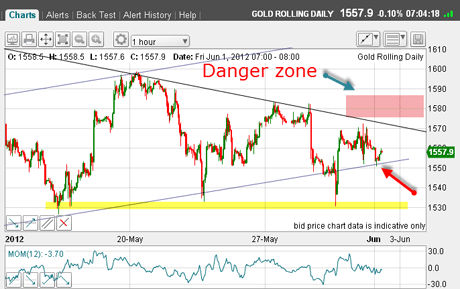
That's why the danger zone for the bears is the area of the pink bar here:
(Click on the chart for a larger version)
The market has bounced off my tramline (red arrow) which is, please note, a 50% Fibonacci retrace of the rally off the $1,530 low and the $1,570 high. Gold could challenge the upper tramline soon.
But if the market declines back below the $1,550 area, we should see a re-challenge of the critical $1,530 region.
Why I'm looking for an opportunity to go short
Of course, everyone and his dog is watching the yellow bar area just follow the blogosphere and the mainstream media and everyone agrees that if this line in the sand is breached, it's chocks away to the downside!
So everyone now is a chartist!
I'm not so sure if only on the basis that if everyone expects a certain outcome, it is unlikely to occur, at least not yet.
I can't tell you which way gold will decide to go. But what I can tell you is that I'm far more comfortable trading it from the short side for now. That's why I'm on the hunt for opportunities to short the rallies.
Where do you sit? If you have any thoughts on gold, why not share them below?
If you're a new reader, or need a reminder about some of the methods I refer to in my trades, then do have a look at my introductory videos:
The essentials of tramline trading
An introduction to Elliott wave theory
Advanced trading with Elliott waves
Don't miss my next trading insight. To receive all my spread betting blog posts by email, as soon as I've written them, just sign up here .
Get the latest financial news, insights and expert analysis from our award-winning MoneyWeek team, to help you understand what really matters when it comes to your finances.
John is is a British-born lapsed PhD physicist, who previously worked for Nasa on the Mars exploration team. He is a former commodity trading advisor with the US Commodities Futures Trading Commission, and worked in a boutique futures house in California in the 1980s.
He was a partner in one of the first futures newsletter advisory services, based in Washington DC, specialising in pork bellies and currencies. John is primarily a chart-reading trader, having cut his trading teeth in the days before PCs.
As well as his work in the financial world, he has launched, run and sold several 'real' businesses producing 'real' products.
-
 Should you buy an active ETF?
ETFs are often mischaracterised as passive products, but they can be a convenient way to add active management to your portfolio
-
 Power up your pension before 5 April – easy ways to save before the tax year end
With the end of the tax year looming, pension savers currently have a window to review and maximise what’s going into their retirement funds – we look at how