Why there could soon be a spectacular move in gold
Gold traders are abandoning their short positions in droves. But is their excitement premature? John C Burford looks to the charts for a clue.
Get the latest financial news, insights and expert analysis from our award-winning MoneyWeek team, to help you understand what really matters when it comes to your finances.
You are now subscribed
Your newsletter sign-up was successful
Want to add more newsletters?

Twice daily
MoneyWeek
Get the latest financial news, insights and expert analysis from our award-winning MoneyWeek team, to help you understand what really matters when it comes to your finances.

Four times a week
Look After My Bills
Sign up to our free money-saving newsletter, filled with the latest news and expert advice to help you find the best tips and deals for managing your bills. Start saving today!
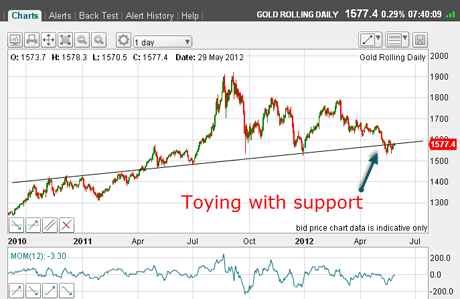
When I last wrote about gold, the market had plunged from the $1,790 February high to meet major support just above the $1,500 level.
In ten weeks, the market had lost around $250 per oz (14%) and had driven momentum to low levels.
As I pointed out in that post, the two previous attempts to break the $1,500 area failed and on both occasions, the market spiked down and then up.
MoneyWeek
Subscribe to MoneyWeek today and get your first six magazine issues absolutely FREE

Sign up to Money Morning
Don't miss the latest investment and personal finances news, market analysis, plus money-saving tips with our free twice-daily newsletter
Don't miss the latest investment and personal finances news, market analysis, plus money-saving tips with our free twice-daily newsletter
Here is the updated daily chart:

(Click on the chart for a larger version)
But this time, there has been no spike.
In fact, the market appears indecisive as it swings first below, and then above the line of support. Previously, the market rejected this area and made hefty rallies off it. But not now at least, not so far.
Traders have turned too bearish
To my eyes, it appears the market is eating away at support prior to another leg down. But let me show you why that move could be delayed.
First, are there any clues to near-term direction from the Commitments of Traders (COT) data? Here are the latest figures:
| (CONTRACTS OF EUR 125,000) OPEN INTEREST: 435,706 | ||||||||
| COMMITMENTS | ||||||||
| 169,551 | 54,400 | 40,854 | 172,750 | 308,348 | 383,155 | 403,602 | 52,551 | 32,104 |
| CHANGES FROM 05/15/12 (CHANGE IN OPEN INTEREST: 13,615) | ||||||||
| 5,500 | 4,491 | 5,425 | 2,134 | -1,185 | 13,059 | 8,731 | 556 | 4,884 |
| PERCENT OF OPEN INTEREST FOR EACH CATEGORY OF TRADERS | ||||||||
| 38.9 | 12.5 | 9.4 | 39.6 | 70.8 | 87.9 | 92.6 | 12.1 | 7.4 |
| NUMBER OF TRADERS IN EACH CATEGORY (TOTAL TRADERS: 300) | ||||||||
| 151 | 75 | 84 | 55 | 45 | 238 | 180 | Row 8 - Cell 7 | Row 8 - Cell 8 |
Remember, at the market highs there were roughly five times as many large specs (non-commercials) long as there were short. It was a similar set-up for the small specs (non-reportables).
But as of 22 May, there are just over three times large spec longs as shorts. For the small specs, the ratio is more evenly balanced, with only just over 1.5 longs toone short.
There has evidently been a large shift of sentiment towards the bearish side. Of course, this is the trend I would expect to accompany a 14% price decline.
But has the market become too bearish? Are there many bearish latecomers to the downtrend since late February that need to be squeezed?
I reckon so and I'm confident the market will try to test their resolve!
Why you must be cautious with gold
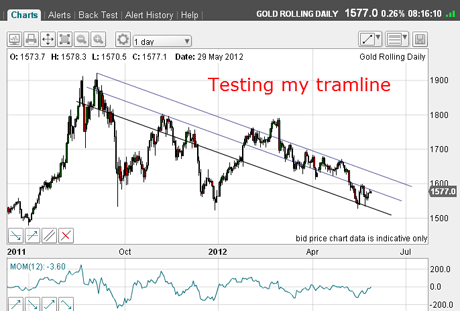
But we're chartists. So what do the charts tell me? Here is the daily chart:

(Click on the chart for a larger version)
I have drawn in my long-standing tramline trio, and this morning the market is attempting to push up through the central line.
But we must be cautious here: gold has a history of spikiness just look at the number of pigtails' where the market has overshot the tramline and rebounded. So, even a modest push above here would not necessarily get me excited.
That's why trading gold with close stops is so very difficult and often costly.You run the risk of being stopped out only to see the market go in your direction again. This is very frustrating and can swear you off trading gold for life.
That's why I usually advocate trading a smaller size in gold, but with wider stops than you would normally use in the Dow or the EUR/USD, for example.
As you have seen over the past few months, it's possible to enter a gold trade with low risk and the rewards can be spectacular.
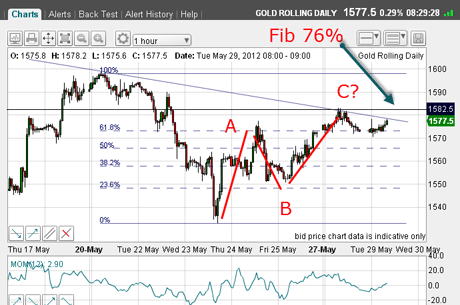
OK, what is the short-term picture? Here is the hourly chart:

(Click on the chart for a larger version)
We have a nice A-B-C rally potentially bearish. Also, the C wave has carried exactly to the Fibonacci 76% retrace yesterday.
When this tug-of-war ends, there could be a major move
So the $1,582 level represents solid resistance. That could be a great area for me to try a short trade.
This morning as I write, the market is attempting to overcome this resistance in sympathy with a rallying EUR/USD and Dow, as these markets are exerting a bullish force on gold.
But one other factor intrudes the rationale for holding gold in the first place. And that is as a hedge against the spectre of collapsing fiat currencies.
If we do see renewed faith in the euro or at least an easing of extreme bearishness that would hurt gold, surely?
Last Friday, I made a case for seeing the euro recover, so this factor must not be rejected out of hand.
This tug-of-war between the bullish effects of a rallying euro and the bearish force of the tramline and Fibonacci resistance should end very soon.
The result could be spectacular!
If you're a new reader, or need a reminder about some of the methods I refer to in my trades, then do have a look at my introductory videos:
The essentials of tramline trading
An introduction to Elliott wave theory
Advanced trading with Elliott waves
Don't miss my next trading insight. To receive all my spread betting blog posts by email, as soon as I've written them, just sign up here .
Get the latest financial news, insights and expert analysis from our award-winning MoneyWeek team, to help you understand what really matters when it comes to your finances.
John is is a British-born lapsed PhD physicist, who previously worked for Nasa on the Mars exploration team. He is a former commodity trading advisor with the US Commodities Futures Trading Commission, and worked in a boutique futures house in California in the 1980s.
He was a partner in one of the first futures newsletter advisory services, based in Washington DC, specialising in pork bellies and currencies. John is primarily a chart-reading trader, having cut his trading teeth in the days before PCs.
As well as his work in the financial world, he has launched, run and sold several 'real' businesses producing 'real' products.
-
 Average UK house price reaches £300,000 for first time, Halifax says
While the average house price has topped £300k, regional disparities still remain, Halifax finds.
-
 Barings Emerging Europe trust bounces back from Russia woes
Barings Emerging Europe trust has added the Middle East and Africa to its mandate, delivering a strong recovery, says Max King