This gold price rally is finished
Elliott wave and Fibonacci theories both point to a trend change in the gold price charts. John C Burford explains.
Get the latest financial news, insights and expert analysis from our award-winning MoneyWeek team, to help you understand what really matters when it comes to your finances.
You are now subscribed
Your newsletter sign-up was successful
Want to add more newsletters?

Twice daily
MoneyWeek
Get the latest financial news, insights and expert analysis from our award-winning MoneyWeek team, to help you understand what really matters when it comes to your finances.

Four times a week
Look After My Bills
Sign up to our free money-saving newsletter, filled with the latest news and expert advice to help you find the best tips and deals for managing your bills. Start saving today!
Goldman Sachs, the world's most prestigious investment bank, has made its mind up about gold.
Goldman analysts think gold is heading below $1,000 per oz. And back in November, when gold was heading for $1,150 per oz, there weren't many who disagreed with Goldman's analysis.
And as I mentioned in my postof the 10December, that was a classic set-up for a contrarian trade. Betting against the crowd would have racked you up $100 in gains so far.
MoneyWeek
Subscribe to MoneyWeek today and get your first six magazine issues absolutely FREE

Sign up to Money Morning
Don't miss the latest investment and personal finances news, market analysis, plus money-saving tips with our free twice-daily newsletter
Don't miss the latest investment and personal finances news, market analysis, plus money-saving tips with our free twice-daily newsletter
If you've been following MoneyWeek Trader, you know that I like to trade on the opposite side of the crowd. That's usually where the money is.
But betting against the crowd isn't the only way to do it. Trading with the herd can be profitable, if you can get on board early enough (when there is no herd to join, ironically).
As the trend develops, the herd swells in size until it reaches a 'sweet spot' (you'll know you've hit the sweet spot when the trend is consistently going in the same direction every day).
It's at about that point that the investment trend has gone mainstream. And that's when it's time for you to get out!
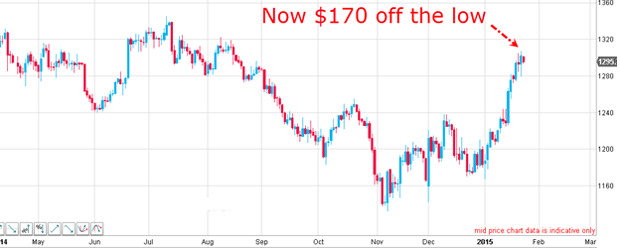
Are we at that point with gold? It has been rising consistently since November. So is it worth taking profits here, and waiting for another opportunity?
A healthy rally dies
(A reminder: A short squeeze happens when the price of an asset starts to rise. When that happens, traders holding short positions begin suffering losses. As they abandon their short positions, they become buyers, and so the price of the asset rises even faster.)
So how have things turned out? Well, it looks like a few short sellers got burned last week.
This is what a short squeeze looks like

Naturally, pundits have noted gold's spectacular climb off November's lows. All of a sudden, many have turned from bearish to bullish. But exactly how bullish are they? How committed are they to this gold rally? If I can get a handle on that, I may be able to locate a short-term top where I can take profits.
One of my favourite sources of sentiment readings is to scan seekingalpha.com articles. Seeking Alpha allows large numbers of investors to post their analysis, unfiltered. So it's a good measure of ordinary investors' sentiment.
Here is the full list of titles from Wednesday when gold was hitting $1,300:
Gold is making encouraging moves, time to invest?
Will gold's spectacular rally continue?
Gold does seem to suggest a different degree of at least uncertainty
Gold surges to 5-month high just shy of $1,300
A mine as a terrible thing to waste
Gold and silver: truly precious so far in 2015 more gains ahead
So there you have it from that small sample, I get a 0% bearish reading.
What does the commitment of traders (COT) data have to say about it? Here is latest data (as of 13 January):
| CONTRACTS OF 100 troy ounces | Row 0 - Cell 1 | Row 0 - Cell 2 | Row 0 - Cell 3 | Open interest: 402,108 | ||||
| Commitments | ||||||||
| 192,959 | 62,733 | 40,729 | 129,436 | 267,112 | 363,124 | 370,574 | 38,984 | 31,534 |
| Changes from 01/06/15 (Change in open interest: 8,087) | ||||||||
| 5,254 | -2,794 | -170 | -991 | 14,013 | 4,093 | 11,049 | 3,994 | -2,962 |
| Percent of open interest for each category of traders | ||||||||
| 48.0 | 15.6 | 10.1 | 32.2 | 66.4 | 90.3 | 92.2 | 9.7 | 7.8 |
| Number of traders in each category (Total traders: 291) | ||||||||
| 130 | 76 | 73 | 51 | 61 | 214 | 185 | Row 8 - Cell 7 | Row 8 - Cell 8 |
The numbers in the red box show even more longs and less shorts that week, which is just what we'd expect as a bull run gathers momentum.
Conclusion: this rally is done
What do the charts say? After all, they are my final arbiter.
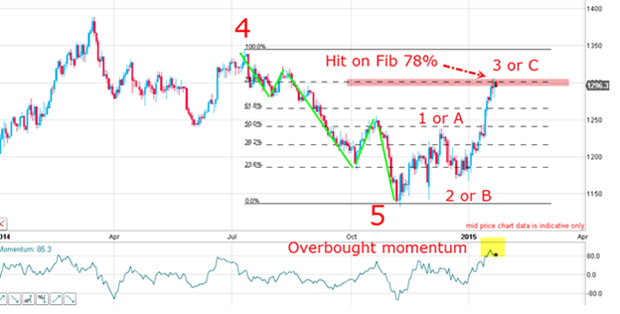
The following chart is complicated, because it shows two separate things.
The first thing the chart is telling me is that the current price which is marked 3 or C on the chart is the third leg of an A-B-C pattern. And, according to Elliott wave theory, the third leg of an A-B-C pattern normally means a change in the trend.
The second thing the chart reveals is that the current gold price is right at the 78% level. And according to Fibonacci theory, it looks likely that the rally should run out of steam around now.
Elliott wave and Fibonacci readings both point to a change in trend

So what should you do? Well, this is the perfect setup to use my split-bet strategy. This means taking half of my profits now, and leaving the remainder open with a trailing stop (A trailing stop sets a floor below a stock price. If the price of the stock drops to your pre-determined floor level, you immediately cash out, limiting your losses.)
That means that if the rally continues, we still make money. If it ends, the trailing stop will protect us from big losses and we'll already have banked some profit on the trade. Heads we win, tails we win!
Get the latest financial news, insights and expert analysis from our award-winning MoneyWeek team, to help you understand what really matters when it comes to your finances.
John is is a British-born lapsed PhD physicist, who previously worked for Nasa on the Mars exploration team. He is a former commodity trading advisor with the US Commodities Futures Trading Commission, and worked in a boutique futures house in California in the 1980s.
He was a partner in one of the first futures newsletter advisory services, based in Washington DC, specialising in pork bellies and currencies. John is primarily a chart-reading trader, having cut his trading teeth in the days before PCs.
As well as his work in the financial world, he has launched, run and sold several 'real' businesses producing 'real' products.
-
 MoneyWeek Talks: The funds to choose in 2026
Podcast Fidelity's Tom Stevenson reveals his top three funds for 2026 for your ISA or self-invested personal pension
-
 Three companies with deep economic moats to buy now
Opinion An economic moat can underpin a company's future returns. Here, Imran Sattar, portfolio manager at Edinburgh Investment Trust, selects three stocks to buy now