I called the bottom of the gold market – here’s how
Using all the methods at his disposal, John C Burford explains how he was able to correctly call the bottom on gold.
Get the latest financial news, insights and expert analysis from our award-winning MoneyWeek team, to help you understand what really matters when it comes to your finances.
You are now subscribed
Your newsletter sign-up was successful
Want to add more newsletters?

Twice daily
MoneyWeek
Get the latest financial news, insights and expert analysis from our award-winning MoneyWeek team, to help you understand what really matters when it comes to your finances.

Four times a week
Look After My Bills
Sign up to our free money-saving newsletter, filled with the latest news and expert advice to help you find the best tips and deals for managing your bills. Start saving today!
Yesterday was one of the most volatile days in the Dow that I can recall.
The Dow swung from an early 300-point rally to a sharp decline of 400 points within four hours.
But I'm not talking about the Dow today. Today, I'm talking about gold, and how, using Elliott wave theory, I called the bottom of the gold market.
MoneyWeek
Subscribe to MoneyWeek today and get your first six magazine issues absolutely FREE

Sign up to Money Morning
Don't miss the latest investment and personal finances news, market analysis, plus money-saving tips with our free twice-daily newsletter
Don't miss the latest investment and personal finances news, market analysis, plus money-saving tips with our free twice-daily newsletter
I knew I was right about gold
the market had hit a major low
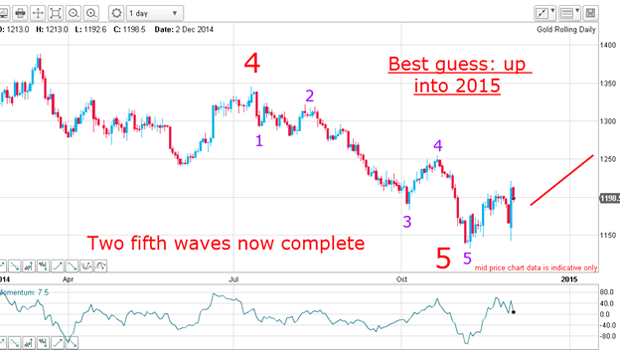
In early November, it was trading at $1,133 and was about to bounce back. This was the chart I posted then:

As you can see, points one to five show this trend fits perfectly into my Elliott wave model.
The market shows five peaks and troughs. According to Elliott wave theory, the fifth marks point at which the trend always changes direction.
That's exactly what happened on 11 November. The trend changed direction and the price of gold started heading up, just as I predicted.
What was happening on the trading floor?
What we saw on 11 Novemberwas a short squeeze.
When the price of gold began to rise, traders holding short positions began suffering losses. As they abandoned their short positions, they became buyers, and so the price of gold rose even faster.
All of this internal and patterned action was displayed in the Elliott waves.
I expect gold price to rise in 2015 in the short term

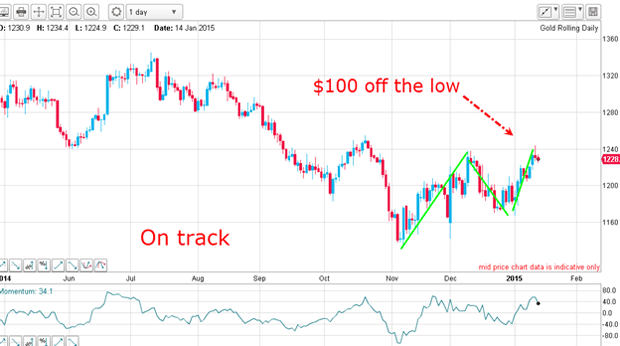
My 2014 forecast is still panning out. This week, gold has rallied $100 off the November low.
So far, the trend remains up.
This snapshot of the commitment of traders data from the Chicago Board of Trade shows an increase in speculators trading long and a decrease in speculators trading short in the first week of 2015.
| (Contracts of 100 troy ounces) | Row 0 - Cell 1 | Row 0 - Cell 2 | Row 0 - Cell 3 | Open interest: 394,021 | ||||
| Commitments | ||||||||
| 187,705 | 65,527 | 40,899 | 130,427 | 253,099 | 359,031 | 359,525 | 34,990 | 34,496 |
| Changes from 12/30/14 (Change in open interest: 20,039) | ||||||||
| 4,808 | -1,533 | 10,240 | 4,609 | 14,147 | 19,657 | 22,854 | 382 | -2,815 |
| Percent of open in terest for each category of traders | ||||||||
| 47.6 | 16.6 | 10.4 | 33.1 | 64.2 | 91.1 | 91.2 | 8.9 | 8.8 |
| Number of traders in each category (Total traders: 291) | ||||||||
| 126 | 82 | 71 | 47 | 59 | 204 | 190 | Row 8 - Cell 7 | Row 8 - Cell 8 |
The upward trend remains in place

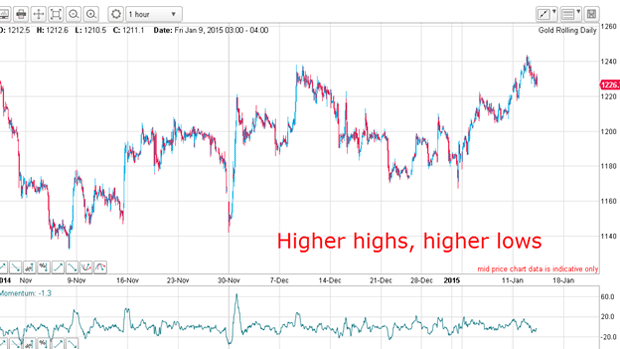
Now, zooming in on the rally starting on 11 November, I can see various waves are spiky and overlapping but it's totally confusing from the Elliott wave perspective. I really cannot see any decent patterns here at all, and so I will abandon looking for Elliott waves.
I have similar thoughts about tramlines there aren't any. So without Elliott waves and tramlines, what do I have left?
Of course, I could draw in the Fibonacci ratios from the various wave highs and lows. But I think I will leave that as an exercise for you, dear reader!
I will say this: the highs and lows have been trending higher and that means one thing: the uptrend is in place for now.
Get the latest financial news, insights and expert analysis from our award-winning MoneyWeek team, to help you understand what really matters when it comes to your finances.
John is is a British-born lapsed PhD physicist, who previously worked for Nasa on the Mars exploration team. He is a former commodity trading advisor with the US Commodities Futures Trading Commission, and worked in a boutique futures house in California in the 1980s.
He was a partner in one of the first futures newsletter advisory services, based in Washington DC, specialising in pork bellies and currencies. John is primarily a chart-reading trader, having cut his trading teeth in the days before PCs.
As well as his work in the financial world, he has launched, run and sold several 'real' businesses producing 'real' products.
-
 Average UK house price reaches £300,000 for first time, Halifax says
While the average house price has topped £300k, regional disparities still remain, Halifax finds.
-
 Barings Emerging Europe trust bounces back from Russia woes
Barings Emerging Europe trust has added the Middle East and Africa to its mandate, delivering a strong recovery, says Max King