Thinning fumes for the Dow Jones index
The Dow Jones has been rising on a wave of hope that the recovery is well underway, says John C Burford. But is that enough to sustain the rally?
Get the latest financial news, insights and expert analysis from our award-winning MoneyWeek team, to help you understand what really matters when it comes to your finances.
You are now subscribed
Your newsletter sign-up was successful
Want to add more newsletters?

Twice daily
MoneyWeek
Get the latest financial news, insights and expert analysis from our award-winning MoneyWeek team, to help you understand what really matters when it comes to your finances.

Four times a week
Look After My Bills
Sign up to our free money-saving newsletter, filled with the latest news and expert advice to help you find the best tips and deals for managing your bills. Start saving today!
On Friday, I wondered if the bull market in the Dow was running on fumes. And this week, we have had a barrage of bullish' economic reports and forecasts for several major economies. For instance, the IMF (International Monetary Fund) has upgraded its projection of GDP growth for the UK from 1.9% to 2.4% in 2014.
But that's not all the big hitters are in Davos. And it seems most of them are very bullish on stocks. Two of these bulls are, in fact, the biggest US hedge fund managers! Here is a quote from one of them that I believe captures the spirit of this market: "The US economy hasn't taken off. It's doing OK. I'm hopeful that growth will pick up..."
That one word gives the game away: hopeful. This man runs a $20bn hedge fund and he is hopeful that growth will pick up? The US markets gained over 25% last year, with only a slight increase in the price/earnings ratios. So I would say that there is actually a whole bubble full of hope in these markets.
MoneyWeek
Subscribe to MoneyWeek today and get your first six magazine issues absolutely FREE

Sign up to Money Morning
Don't miss the latest investment and personal finances news, market analysis, plus money-saving tips with our free twice-daily newsletter
Don't miss the latest investment and personal finances news, market analysis, plus money-saving tips with our free twice-daily newsletter
Is it the end of the road for hope'?
Let's look at the charts since they reveal what the market is really thinking. Here is the hourly chart I showed on Monday:
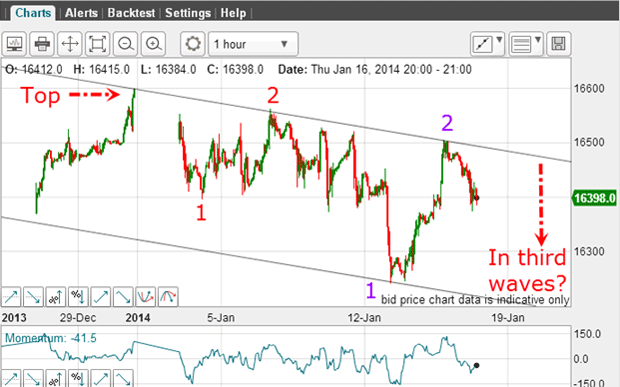
I have a solid tramline pair working. And the gap produced on 2 January remains unfilled, despite several attempts to close it.
A gap in the chart is a very significant feature. And the fact is, most of them get filled in quickly by subsequent price action. If a gap goes unfilled for any length of time, it generally is an indication that it will not be closed. That's when the path of least resistance is away from the gap.
Let's examine the trading pattern since Monday:
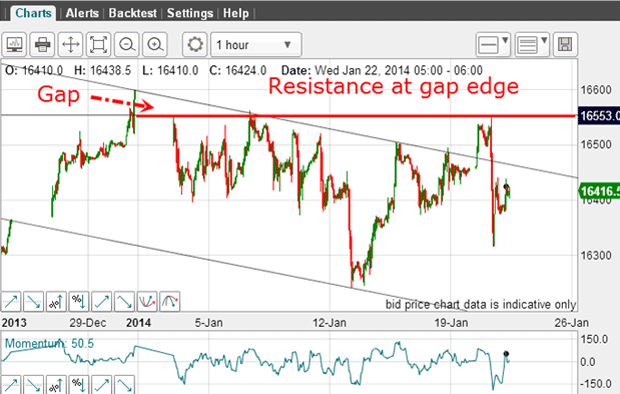
The market made another dash for the gap following the upper tramline break. But it was stopped dead in its tracks by heavy selling that followed the bullish' growth forecasts. Note this was the third attempt to close the gap, and it failed spectacularly.
But I have another revealing short-term tramline pair to apply to the chart:
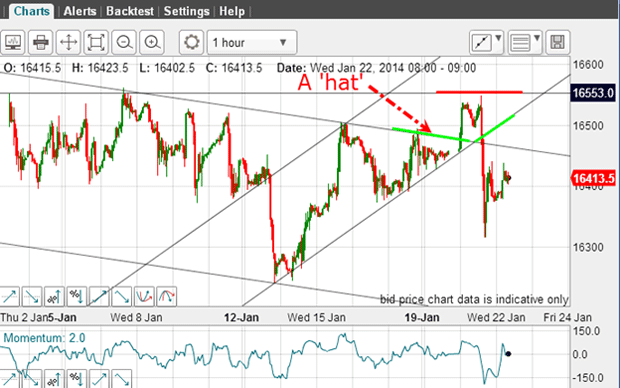
The rally off the 12 January low is within the trading channel between my up-sloping tramlines. The lower line contains multiple lows and the upper line has a superb PPP (prior pivot point), while cutting across the major 16,500 high. This is about as reliable a tramline pair as you will find.
How to know if a break is genuine
The main tramline was resistance before the break. But that tramline has now been transformed into support. Normally, we see a kiss of this tramline before the market resumes its uptrend if the break is genuine.
But the strength of the gap resistance line (red) overcame the potential support of the kiss. The market then fell straight through the hat in a kiss failure. I find that when hats fail to provide support and then break, the move away is usually very intense. That is what we found here it's a textbook example of this rule.
But was there another clue that the hat would give way?
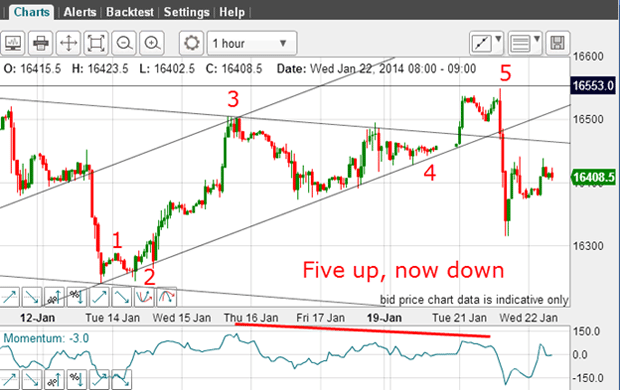
The rally up from the 14 January low is a complete five waves up, with a long and strong wave 3 and a negative-momentum divergence at wave 5. This is a perfect setup for a trend reversal. Remember, five complete waves always leads to a reversal, according to Elliott wave theory.
Proof that markets are not manipulated
For that target, I need to draw in a third tramline, which I always do after a tramline break:
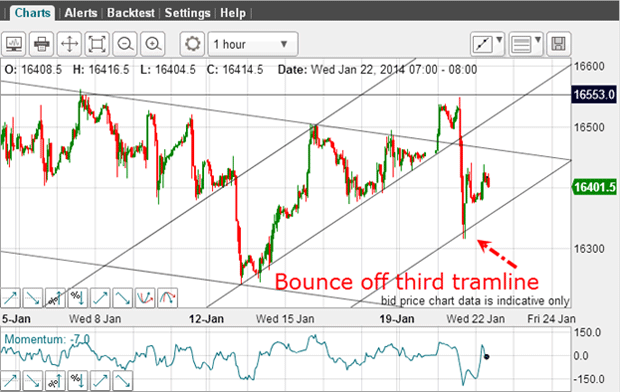
And here it is. The market was in virtual freefall and yet the market knew' where to stop falling on my third tramline target! Isn't that incredible?
With such rules being observed time after time, can anyone say markets are manipulated?
So, with just a little knowledge of my simple charting methods, a short trade could have been put on just under my hat. It would have then covered near the third tramline for a very swift 150-pip gain. Longer-term traders would remain short.
That is the power of my tramline trading methods.
And the 1-2 Elliott waves I showed on Friday may well be operating.
Get the latest financial news, insights and expert analysis from our award-winning MoneyWeek team, to help you understand what really matters when it comes to your finances.
John is is a British-born lapsed PhD physicist, who previously worked for Nasa on the Mars exploration team. He is a former commodity trading advisor with the US Commodities Futures Trading Commission, and worked in a boutique futures house in California in the 1980s.
He was a partner in one of the first futures newsletter advisory services, based in Washington DC, specialising in pork bellies and currencies. John is primarily a chart-reading trader, having cut his trading teeth in the days before PCs.
As well as his work in the financial world, he has launched, run and sold several 'real' businesses producing 'real' products.
-
 MoneyWeek Talks: The funds to choose in 2026
Podcast Fidelity's Tom Stevenson reveals his top three funds for 2026 for your ISA or self-invested personal pension
-
 Three companies with deep economic moats to buy now
Opinion An economic moat can underpin a company's future returns. Here, Imran Sattar, portfolio manager at Edinburgh Investment Trust, selects three stocks to buy now