The Dow Jones index rallies on fumes
Since the start of the year, the Dow has lagged behind other markets. Has the bull market run out of puff? John C Burford examines the charts.
Get the latest financial news, insights and expert analysis from our award-winning MoneyWeek team, to help you understand what really matters when it comes to your finances.
You are now subscribed
Your newsletter sign-up was successful
Want to add more newsletters?

Twice daily
MoneyWeek
Get the latest financial news, insights and expert analysis from our award-winning MoneyWeek team, to help you understand what really matters when it comes to your finances.

Four times a week
Look After My Bills
Sign up to our free money-saving newsletter, filled with the latest news and expert advice to help you find the best tips and deals for managing your bills. Start saving today!
I have neglected the Dow lately because there were more pressing markets to cover. But today, I thought I would analyse the Dow since it is now giving me some important trading signals.
On 18 December, when I last wrote on the Dow, the market was expecting the Fed to announce their intentions regarding a possible tapering of their quantitative easing (QE) programme. And sure enough, they did say they would scale back their bond purchases by $10bn a month until the end of 2014, when the buying will cease altogether.
The reaction of the market was generally positive. The Dow rallied on the news, and the US markets have maintained their strength since then. The Dow, the Nasdaq and the S&P have made new highs. And on 31 December, the Dow closed the year at an all-time high of 16,600.
MoneyWeek
Subscribe to MoneyWeek today and get your first six magazine issues absolutely FREE

Sign up to Money Morning
Don't miss the latest investment and personal finances news, market analysis, plus money-saving tips with our free twice-daily newsletter
Don't miss the latest investment and personal finances news, market analysis, plus money-saving tips with our free twice-daily newsletter
But when the market re-opened on 2 January, the Dow opened with a large gap to the downside. So why the change of heart in the new year? While the Nasdaq and S&P have since gone on to make even higher highs, the Dow has not. So far, the 31 December high at 16,600 still holds. Can we make anything of this divergence?
The bigger picture
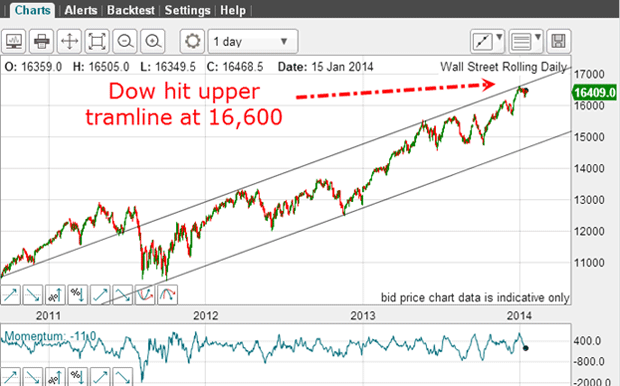
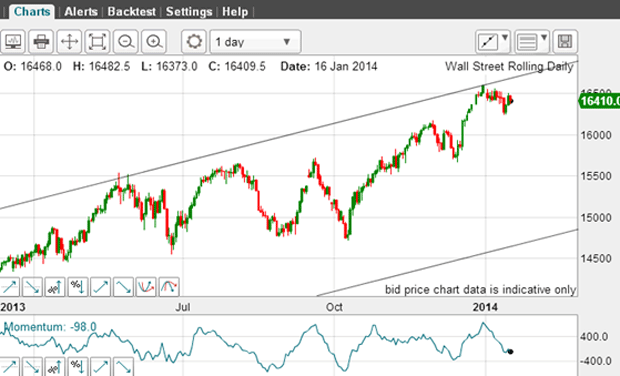
Here are my long-term tramlines on the daily chart going back to 2011. There is a terrific upper tramline with multiple PPPs (prior pivot points). The December rally high took the market to a precise hit on this line, fully respecting it as a level of strong resistance which has lasted for over two years.
Here is a close-up of the tramline hit:
And here is the recent trading on the hourly chart:
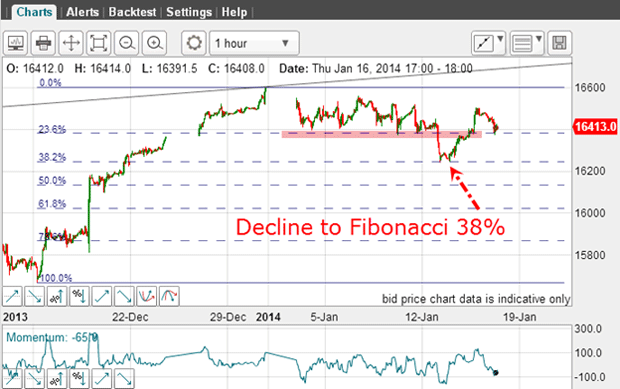
Since early January, the market has been supported by the Fibonacci 23% support level. But that support finally failed and it rapidly declined to the next level at the 38% retracement. From there it staged the latest rally, which has not carried to a new high.
Finding a touch point for your tramlines
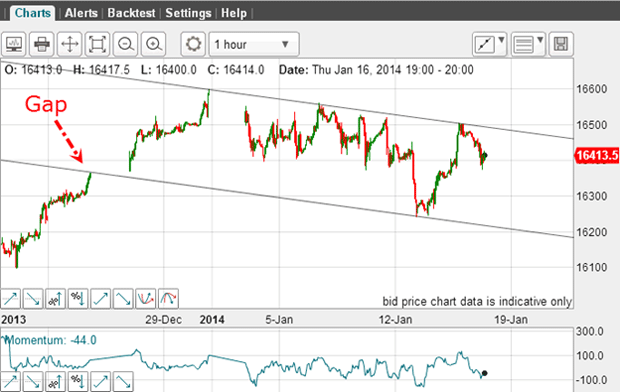
I have a terrific tramline pair where the market has rallied to the upper line (resistance) and then has been turned back. My lower line is significant because I have the start of the gap as a touch point. Because gaps are very rare, they can be normally used as a touch point for your tramlines.
As a case in point, here is the Nikkei over the same period:
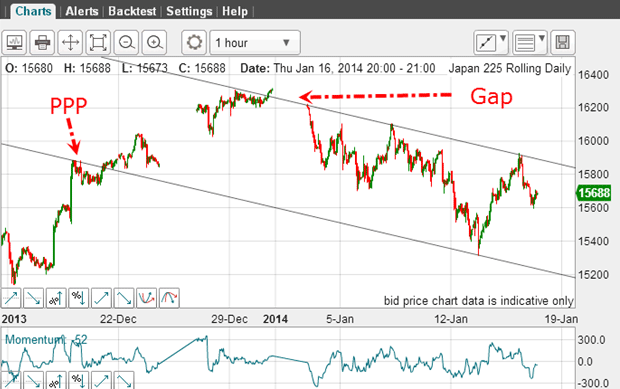
I have my lower tramline with its fine PPP and the sole touch point is the major low. Then, my upper tramline has the two minor highs and the opening year's gap as touch points.
Comparing the two markets, they are similar in outline but differ in the details.
The lesson is this: when you have a gap on a chart, you can use either end as a touch point for a tramline.
Making the case for a third wave decline
As for the Elliott waves(EW) here, I can make a case that we are on the verge of a third wave decline of several degrees. If you recall, I have noted that when the Dow has staged a decent decline, there were deep retracements before the decline could get under way. And this may be happening here.
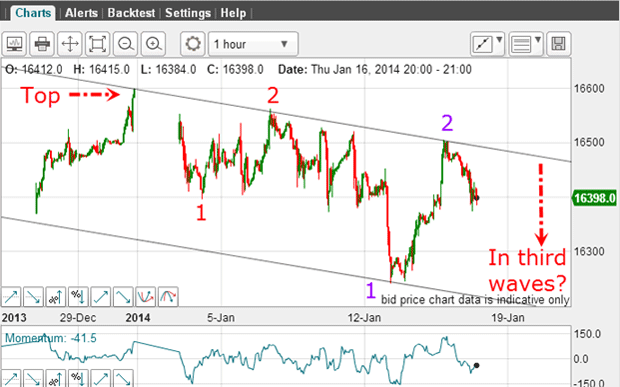
Here is a credible EW count with two 1-2s working. The second waves have both deeply retraced the first waves. But to confirm this count, the market will need to move rapidly down to the lower tramline to produce the characteristic long and strong move of a third wave.
That action would then place the 31 December high as the top.
But if the market fails to do this and moves back up to challenge the upper line again, the odds would swing to a break of the upper tramline and on to a new high.
Why this bull market is not unloved
For instance, the NYSE margin debt has just hit an all-time high, which highlights the extreme optimism of the bulls. Money to buy shares is not borrowed when stocks are unloved!
And since last October, the New Highs Minus New Lows figures on the NYSE has been lagging the market in a very large divergence. The latest rally has been driven by fewer and fewer individual stocks making new highs.
This is a sign of a very tired bull market. And that means when the turn does arrive, it will be sharp and swift.
Get the latest financial news, insights and expert analysis from our award-winning MoneyWeek team, to help you understand what really matters when it comes to your finances.
John is is a British-born lapsed PhD physicist, who previously worked for Nasa on the Mars exploration team. He is a former commodity trading advisor with the US Commodities Futures Trading Commission, and worked in a boutique futures house in California in the 1980s.
He was a partner in one of the first futures newsletter advisory services, based in Washington DC, specialising in pork bellies and currencies. John is primarily a chart-reading trader, having cut his trading teeth in the days before PCs.
As well as his work in the financial world, he has launched, run and sold several 'real' businesses producing 'real' products.
-
 Average UK house price reaches £300,000 for first time, Halifax says
While the average house price has topped £300k, regional disparities still remain, Halifax finds.
-
 Barings Emerging Europe trust bounces back from Russia woes
Barings Emerging Europe trust has added the Middle East and Africa to its mandate, delivering a strong recovery, says Max King