The euro hits my target at 1.32
The euro has broken out of its long-term downtrend for the first time in over a year. A potentially bullish move. But can the upward break be trusted? John C Burford investigates.
Get the latest financial news, insights and expert analysis from our award-winning MoneyWeek team, to help you understand what really matters when it comes to your finances.
You are now subscribed
Your newsletter sign-up was successful
Want to add more newsletters?

Twice daily
MoneyWeek
Get the latest financial news, insights and expert analysis from our award-winning MoneyWeek team, to help you understand what really matters when it comes to your finances.

Four times a week
Look After My Bills
Sign up to our free money-saving newsletter, filled with the latest news and expert advice to help you find the best tips and deals for managing your bills. Start saving today!
As market activity winds down for the Christmas break, I expect trading volumes to slacken off. But that doesn't necessarily mean volatility will follow.
Rest assured though, any moves in this period are still valid for my trading methods, and I will be observing them with the same diligence as usual.
I have neglected the euro recently since we have seen some great examples of tramline, Fibonacci and Elliott wave action in the Dow and gold that I just had to cover.
MoneyWeek
Subscribe to MoneyWeek today and get your first six magazine issues absolutely FREE

Sign up to Money Morning
Don't miss the latest investment and personal finances news, market analysis, plus money-saving tips with our free twice-daily newsletter
Don't miss the latest investment and personal finances news, market analysis, plus money-saving tips with our free twice-daily newsletter
I hope you have found a trade in gold that I set on Friday I shall get to that before the break.
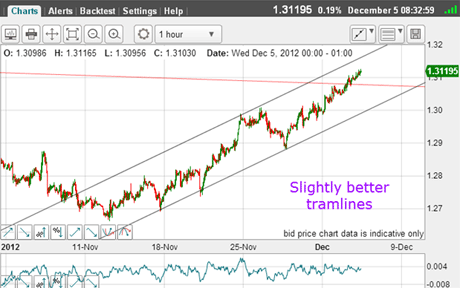
In my last article on the euro, I had some targets set. The first was in the 1.32 region, as the market had rallied above my long-term tramline.
This was the picture then on the hourly chart:
(Click on the chart for a larger version)
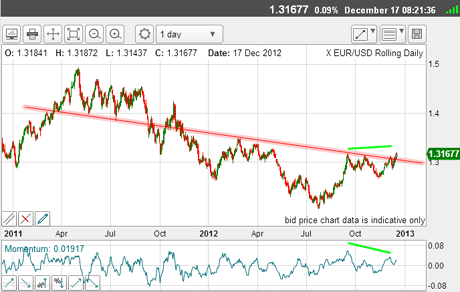
The red line is my long-term downtrend line drawn off the touch points from 2011. To refresh our memories, here is my long-term chart:
(Click on the chart for a larger picture)
The market has clearly broken above my red line for the first time in over a year. This is potentially bullish. But one caution is that momentum is lagging price (so far) as marked by my green bars. The question is, is this upward break to be trusted?
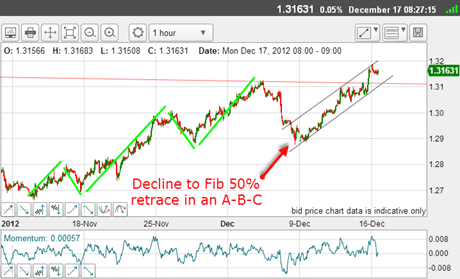
And this is the hourly chart as I write:
(Click on the chart for a larger picture)
The rally off the 13 November low to the red trendline is a beautiful five-wave pattern. That was straight out of the Elliott wave textbook. Note the negative momentum divergence at the ending fifth wave to confirm the end was nigh.
And, as our Elliott wave knowledge could forecast, the decline was in an A-B-C and reversed right at the Fibonacci 50% support. Again, pure textbook.
I hope you see that with this basic knowledge of Elliott wave theory combined with Fibonacci retracements, you are able to make very accurate forecasts with which you can place correct trades.
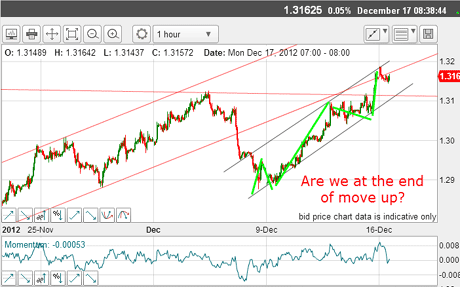
You will see that I have some tramlines drawn in on the latest leg up, so let's take a closer look:
(Click on the chart for a larger picture)
I have my original tramline pair in red and right away, my 1.32 target has come within a whisker of being hit this morning on the overnight Japan election news. Nice.
But just look at the pattern I have drawn in green on this latest leg. I can see a very convincing five-wave pattern contained between my black tramlines. If we are in the fifth and final wave up, then we should expect a decline to start at any time.
Also, we have a crossing of the upper black tramline and the lower red one a point of enhanced resistance with the market currently trading in this area.
Naturally, if the market can break the lower black tramline and the red long-term trendline, which crosses it that would give this morning's high a high-probability top.
One other important indication that we may see the top in this region is this:
(Click on the chart for a larger picture)
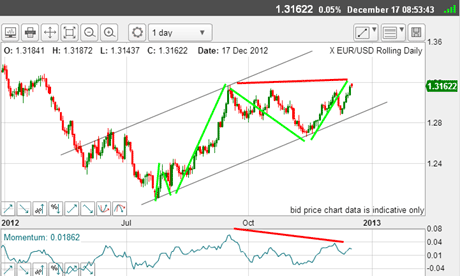
This is the daily chart showing the rally off the 1.20 low in a clear five-wave move. These labels obey all of the Elliott wave theory rules and guidelines with a large third wave topping on very high momentum and an A-B-C in the fourth wave.
With the slight new high today - and with a potential negative momentum divergence (red bars) we are now in the fifth wave, which could end at any time. Thus, we are potentially in two fifth waves of different degree.
I shall be on the lookout for signs of a reversal and hope to have a trade soon, when I will get up off my hands.
Incidentally, at my workshops in April and September, I gave a bonus trade as one to take a serious look at. It was the USD/JY. At both workshops, I had set my first major target at 84, which was just hit in overnight trading as the Japanese election results came through. I am planning more workshops for 2013, so do watch out for my announcements.
If you're a new reader, or need a reminder about some of the methods I refer to in my trades, then do have a look at my introductory videos:
The essentials of tramline trading
An introduction to Elliott wave theory
Advanced trading with Elliott waves
Don't miss my next trading insight. To receive all my spread betting blog posts by email, as soon as I've written them, just sign up here . If you have any queries regarding MoneyWeek Trader, please contact us here.
Get the latest financial news, insights and expert analysis from our award-winning MoneyWeek team, to help you understand what really matters when it comes to your finances.
John is is a British-born lapsed PhD physicist, who previously worked for Nasa on the Mars exploration team. He is a former commodity trading advisor with the US Commodities Futures Trading Commission, and worked in a boutique futures house in California in the 1980s.
He was a partner in one of the first futures newsletter advisory services, based in Washington DC, specialising in pork bellies and currencies. John is primarily a chart-reading trader, having cut his trading teeth in the days before PCs.
As well as his work in the financial world, he has launched, run and sold several 'real' businesses producing 'real' products.
-
 How a ‘great view’ from your home can boost its value by 35%
A house that comes with a picturesque backdrop could add tens of thousands of pounds to its asking price – but how does each region compare?
-
 What is a care fees annuity and how much does it cost?
How we will be cared for in our later years – and how much we are willing to pay for it – are conversations best had as early as possible. One option to cover the cost is a care fees annuity. We look at the pros and cons.