Gold hits another target – again
The gold price has rallied to John C Burford's tramline target for solid profits. But could the market be preparing for another strong move upwards?
Get the latest financial news, insights and expert analysis from our award-winning MoneyWeek team, to help you understand what really matters when it comes to your finances.
You are now subscribed
Your newsletter sign-up was successful
Want to add more newsletters?

Twice daily
MoneyWeek
Get the latest financial news, insights and expert analysis from our award-winning MoneyWeek team, to help you understand what really matters when it comes to your finances.

Four times a week
Look After My Bills
Sign up to our free money-saving newsletter, filled with the latest news and expert advice to help you find the best tips and deals for managing your bills. Start saving today!
When I last covered gold on Monday, I noted the five-wave move down off the November $1,750 high which signalled a resumption of the bear market.
From the early December $1,680 lows, the market then embarked on the fully-expected counter-trend rally.
The challenge for swing traders in these situations is simple:where will the market turn from this rally so that new short trades at low risk can be entered?
MoneyWeek
Subscribe to MoneyWeek today and get your first six magazine issues absolutely FREE

Sign up to Money Morning
Don't miss the latest investment and personal finances news, market analysis, plus money-saving tips with our free twice-daily newsletter
Don't miss the latest investment and personal finances news, market analysis, plus money-saving tips with our free twice-daily newsletter
Do I have a trade?
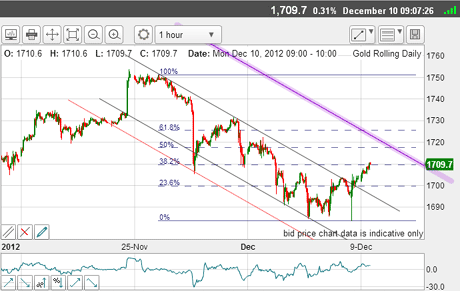
Let's look at the picture since December.
I had my excellent tramlines in place and the Fibonacci retrace levels.
My methods say that if I can see an A-B-C formation on this rally leg, then I have a trade!
(Click on the chart for a larger version)
And on Monday, I wrote: "So I have placed my upper tramline (purple) equidistant from that one and that is my next target. As it happens, it crosses the Fibonacci 50% level in the $1,720 area, making this an important resistance area.
"If the market reaches it, I will be looking to re-establish shorts again and ride the next wave down. Remember, my analysis says that we are in a large third wave down".
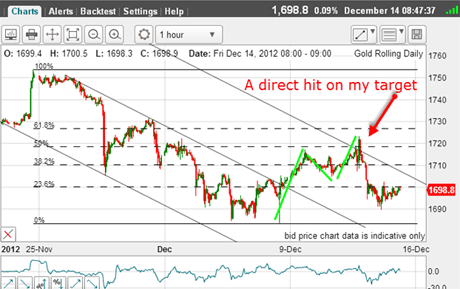
That was my upper target at the $1,720 level.
And this is the picture this morning:
(Click on the chart for a larger version)
The market rallied in an A-B-C (green bars) to make a direct hit on my target zone the rally being prompted by the initial reaction to the Fed announcement for more QE.
Trader tip: When there is a date and time-certain event approaching (such as the much-anticipated Fed news), the market will often move strongly into it. As the news is released, the move is often extended.This is an ideal opportunity to 'fade' the move.Fading means taking an opposite stance to that of the move. In this case, there was a rally to be shorted into.
As occurred, the move was a false one and the market sank heavily within minutes. Protective buy stops can then be placed just above the spike top, as a rally beyond it would almost certainly catch the shorts on the hop and larger gains would be expected from the huge waves of short-covering.That spike top is a very important point.
Could gold rally above $1,720?
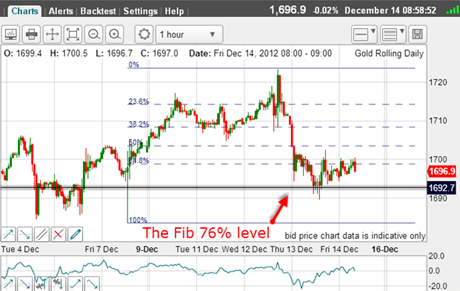
That was the end of the rally at least for now. The market has moved down to the $1,690 - $1,700 zone where support has emerged - and this is why:
(Click on the chart for a larger version)
Taking the rally off the low to the $1,723 high, I plot the Fibonacci levels of this wave up. Right away, the decline stopped at the Fibonacci 76% level a common stopping point and where short-term profits can be taken for a nice gain of over 200 pips, or £200-plusper £1 bet.
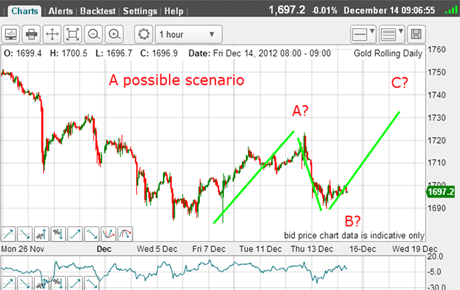
Now, this sets up an interesting possibility. If the rally off the $1,680 low has not yet completed, and the large wave 3 down move is not yet ready to launch, we could see a rally from here to extend above $1,720 in this fashion:
(Click on the chart for a larger version)
If this plays out, a good target would be the $1,730 area, the Fibonacci 62% level.There would be a larger A-B-C move, of course.
As I never tire of saying, forecasting is all about probability estimating. What is the relative likelihood of this scenario playing out compared with a resumption of the downtrend?
If we assume the probabilities are about even (without further evidence), then if you were tending towards a long trade, you would do a cost/benefit analysis along the following lines:
If I entered long here at $1,697, I could place my protective stop at $1,687, just under the recent low (a move there would certainly place the first scenario much more likely, and you could reverse your stance to short). That would be a $10 risk.
The potential reward? If wave C ends around the $1,730 area, that would indicate a potential profit of $30 or so. This would give the trade a reward/risk ratio of better than three-to-one.This is a very decent result and many traders would take it.
But if you were bearish and believed the market is back on its declining track, would you enter a short trade here and if so, where would you place stops?
Hint: Find your tramlines first, if any.
If you're a new reader, or need a reminder about some of the methods I refer to in my trades, then do have a look at my introductory videos:
The essentials of tramline trading
An introduction to Elliott wave theory
Advanced trading with Elliott waves
Don't miss my next trading insight. To receive all my spread betting blog posts by email, as soon as I've written them, just sign up here . If you have any queries regarding MoneyWeek Trader, please contact us here.
Get the latest financial news, insights and expert analysis from our award-winning MoneyWeek team, to help you understand what really matters when it comes to your finances.
John is is a British-born lapsed PhD physicist, who previously worked for Nasa on the Mars exploration team. He is a former commodity trading advisor with the US Commodities Futures Trading Commission, and worked in a boutique futures house in California in the 1980s.
He was a partner in one of the first futures newsletter advisory services, based in Washington DC, specialising in pork bellies and currencies. John is primarily a chart-reading trader, having cut his trading teeth in the days before PCs.
As well as his work in the financial world, he has launched, run and sold several 'real' businesses producing 'real' products.
-
 Pension Credit: should the mixed-age couples rule be scrapped?
The mixed-age couples rule was introduced in May 2019 to reserve pension credit for older households but a charity warns it is unfair
-
 Average income tax by area: The parts of the UK paying the most tax mapped
The UK’s total income tax bill was £240.7 billion 2022/23, but the tax burden is not spread equally around the country. We look at the towns and boroughs that have the highest average income tax bill.