How Elliot waves showed me my next gold target
Basic Elliott wave theory has provided John C Burford with the holy grail of all swing traders, a high-probability/low-risk entry in the gold market. Here, he explains how.
Get the latest financial news, insights and expert analysis from our award-winning MoneyWeek team, to help you understand what really matters when it comes to your finances.
You are now subscribed
Your newsletter sign-up was successful
Want to add more newsletters?

Twice daily
MoneyWeek
Get the latest financial news, insights and expert analysis from our award-winning MoneyWeek team, to help you understand what really matters when it comes to your finances.

Four times a week
Look After My Bills
Sign up to our free money-saving newsletter, filled with the latest news and expert advice to help you find the best tips and deals for managing your bills. Start saving today!
Today I want to follow up on the gold story, since it is a superb real-time example of how I use basic Elliott wave theory to provide me with a roadmap of the terrain that lies just ahead.
The great benefit of this theory is that it gives fairly precise indications of what to expect in terms of the various waves, both up and down. And by incorporating Fibonacci retracements, I can have a good idea of the price level where I can expect the waves to turn. This gives me a high-probability/low-risk entry the holy grail of all swing traders.
All traders need a reliable system to detect these great trades. Mine is just one of many. It works well because it's easy to understand - suitable for people like me, who resist cluttering up their minds with unhelpful complications!
MoneyWeek
Subscribe to MoneyWeek today and get your first six magazine issues absolutely FREE

Sign up to Money Morning
Don't miss the latest investment and personal finances news, market analysis, plus money-saving tips with our free twice-daily newsletter
Don't miss the latest investment and personal finances news, market analysis, plus money-saving tips with our free twice-daily newsletter
I firmly believe that to operate effectively, we all must have a very clear and simple set of time-honoured rules to keep us on track. It so easy to be seduced into believing the more you know, the better trader you will be. This applies especially to reading research reports!
(As you know, I rarely mention the fundamentals behind the markets this is because studying them does not make me money!)
But of course nothing on this earth is 100% predictable, and Elliott wave theory is no exception. But it is about the only method I know where, if the market does not conform to the roadmap, it is time to consider abandoning the trade and searching for different wave labels. It gives you a line on the sand and that is very valuable.
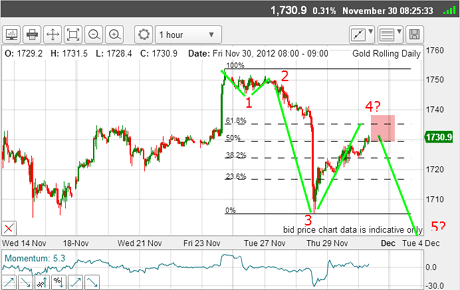
OK, when I left gold on 30 November, the rally had taken it to the $1,750 level, which was my original Fibonacci target, and then the market had plunged down through a tramline to a low of $1,705, and was staging a bounce. This was the picture then:

(Click on the chart for a larger version)
I had my suggested Elliott wave labels in place and the market was entering my target zone at or above the Fibonacci 50% retrace.
This is what I wrote then: "It looks as if we have wave 1 down, then wave 2 up. Then a huge wave 3 down (long and strong) and currently, we are in a wave 4 up which could end at the Fibonacci 50%-62% retrace (pink zone), before moving to new lows in the fifth wave below major support at the $1,700 area.
"So it appears we are in a large third wave down and within this wave, we are working on a smaller five wave pattern."
So my roadmap was this: a wave 4 top, then a big move down in wave 5, taking it to below the wave 3 low. It all hinged on seeing a turn near current levels and a big move down. Anything else would make me review this forecast. And this is what occurred:

(Click on the chart for a larger version)
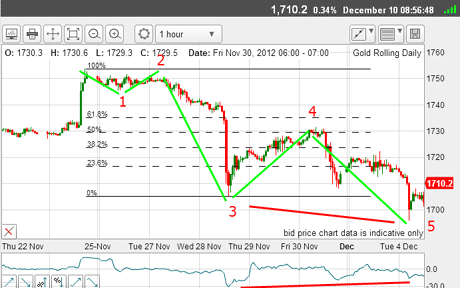
The market did top at the Fibonacci 50% level for wave 4, and then plunged to the wave 5 low below the wave 3 low. Nice.
Of course, the wave 4 top was a super entry for another high probability/low risk entry.
My new roadmap
One question that often pops up is this: How do I know I have wave 5 labelled correctly? After all, could the market not plunge even further?
The answer is simple: I don't know that with 100% certainty. But I do know that the odds favour a bounce off my wave 5 low, as momentum is diverging (red bars). This is often a clue that selling is drying up and support coming back in.
Elliott wave theory states that since we have a definitive five-wave down move, two things can be said: first, that the larger trend is now down; and second, that the next immediate move is up in a corrective move (ideally in an A-B-C).
That is why I was on high alert for signs of bottoming action last week. I found it, which enabled me to take some profits from my short trade from $1,740 off the table.
So let's see where we are as I write:

(Click on the chart for a larger version)
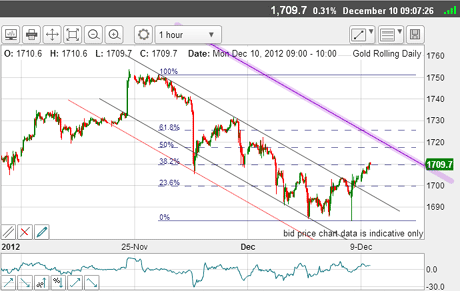
Friday's action was interesting! We saw a challenge to the wave 5 low at $1,683, but there was strong buying here and the market zoomed back up in a spike on the hourly chart.
I could then draw a good-looking tramline connecting the highs off the $1,750 low, which the market broke late on Friday, and this morning is heading up again.
The market is following my roadmap to a T so far.
I have two possibilities for my lowest tramline. The red line shows the extreme, while the one above is slightly better with two touch points.
So I have placed my upper tramline (purple) equidistant from that one and that is my next target. As it happens, it crosses the Fibonacci 50% level in the $1720 area, making this an important resistance area.
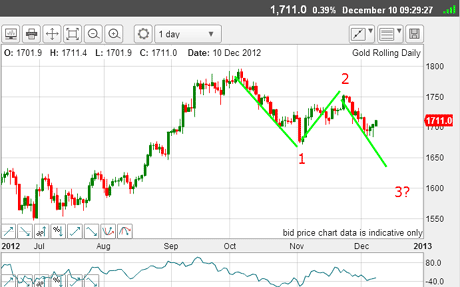
If the market reaches it, I will be looking to re-establish shorts again and ride the next wave down. Remember, my analysis says that we are in a large third wave down:

(Click on the chart for a larger version)
This is the daily chart showing my wave labels. If correct, the current rally will top and we should eventually see new lows below the wave 1 low. But it may take several days to make it. I like the wave 2 A-B-C as that increases the odds I have wave 2 correct.
But so far, my simple Elliott Wave forecasts are being proved good and I have taken money from gold because I have followed my rules.
and I have not spent a moment trying to figure out what the fundamentals mean!
If you're a new reader, or need a reminder about some of the methods I refer to in my trades, then do have a look at my introductory videos:
The essentials of tramline trading
An introduction to Elliott wave theory
Advanced trading with Elliott waves
Don't miss my next trading insight. To receive all my spread betting blog posts by email, as soon as I've written them, just sign up here . If you have any queries regarding MoneyWeek Trader, please contact us here.
Get the latest financial news, insights and expert analysis from our award-winning MoneyWeek team, to help you understand what really matters when it comes to your finances.
John is is a British-born lapsed PhD physicist, who previously worked for Nasa on the Mars exploration team. He is a former commodity trading advisor with the US Commodities Futures Trading Commission, and worked in a boutique futures house in California in the 1980s.
He was a partner in one of the first futures newsletter advisory services, based in Washington DC, specialising in pork bellies and currencies. John is primarily a chart-reading trader, having cut his trading teeth in the days before PCs.
As well as his work in the financial world, he has launched, run and sold several 'real' businesses producing 'real' products.
-
 The most single-friendly areas to buy a property
There can be a single premium when it comes to getting on the property ladder but Zoopla has identified parts of the UK that remain affordable if you aren’t coupled-up
-
 RICS: UK housing market showing signs of 'tentative recovery'
RICS members are becoming less negative about property sales and house prices. What does the latest data mean for the property market?