I know I promised to cover the Dow this week, and I will get to it on Friday. But I will continue my coverage of the euro because it is this week making a break upwards of a significant tramline going back over two years more later.
Recall on Monday, I showed the euro breaking upwards through my tramline on the hourly chart which took the market up to my long-term tramline on the daily.
I then wrote: "But the market is obviously in the danger zone for the bears. A push above the line would make the 50% Fibonacci level at roughly 1.32 the next target. And the spring highs in the 1.32 1.34 zone look very tempting!"
Try 6 free issues of MoneyWeek today
Get unparalleled financial insight, analysis and expert opinion you can profit from.

Sign up to Money Morning
Don't miss the latest investment and personal finances news, market analysis, plus money-saving tips with our free twice-daily newsletter
Don't miss the latest investment and personal finances news, market analysis, plus money-saving tips with our free twice-daily newsletter
Since then the market has rallied further, and those targets are heaving closer into view.

So let's go back to the long-term chart:
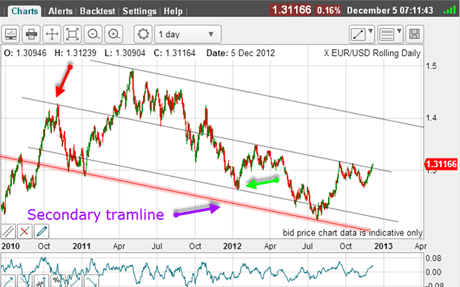
(Click on the chart for a larger version)
First, I drew the centre tramline using the magnificent prior pivot point (PPP) from November 2010 (red arrow) and taking in the most recent highs. This is a first-class tramline!
Then, I drew in the lower tramline using the single touch point low from January 2012 (green arrow). This is a very tentative tramline, but its position is strengthened by my upper tramline passing across the major 1.50 high.
I also have a secondary tramline (in red) which passes through major lows in 2010/2011 and the recent 1.20 low. This is a significant line to be kept on the chart.
But notice that the centre tramline has been broken this week. I believe this is significant.
So let's now zoom in on the hourly:
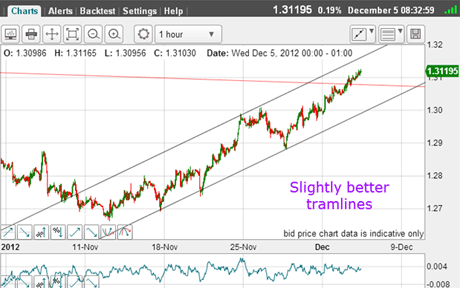
(Click on the chart for a larger version)
With the 28 November low, I can draw a slightly better set-up than I could on Monday with my new lower tramline sportingthree touch points. My new upper tramline has a new PPP, so that is good.
Trader tip: When searching for tramlines in real time, the best policy is to start with a line that passes through at least two touch points (as I did with my new lower line). When that is in place, move the parallel line across the chart so that it picks up at least two touch points and better yet, a PPP in addition.
The market has now broken above my long-term tramline (in red).
Trader tip: More often than not, when a tramline has been penetrated, the market will come back to kiss it before either resuming the uptrend or moving back inside the trading channel. This means you can place protective stops quite close to the line inside the channel in case the latter occurs.
So now I have an upper target the upper tramline close to 1.32.
But can I find targets from another method to confirm this target?
Let's have a look at the Fibonacci retrace levels on the daily chart:
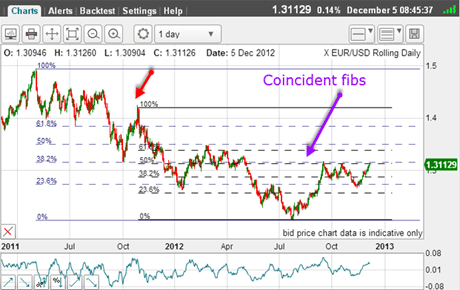
(Click on the chart for a larger version)
Here are two sets one from the 1.50 top and the other from the very significant high (red arrow).
Isn't it curious that the 50% level from the latter lies at the same place as the 38% of the former?
This is not just curious, but of major significance, as this area represents super-strong resistance.
Note how the market was turned back twice in September and in October, thereby proving the solid resistance.
The 1.32 level lies slightly above this area, so will this push be the third time lucky?
Let's zoom in again:
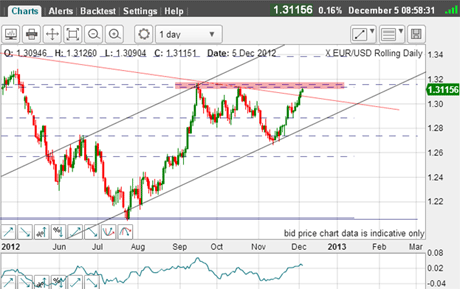
(Click on the chart for a larger version)
The pink zone is my resistance. A push above would make my Elliott wave ideas from Monday more credible, and bring my 1.32-1.34 target zone into focus.
I have a new tramline pair working on this daily chart and even higher targets are now possible. Note the next Fibonacci level lies in the 1.34 area. Hmm.
If you're a new reader, or need a reminder about some of the methods I refer to in my trades, then do have a look at my introductory videos:
The essentials of tramline trading
An introduction to Elliott wave theory
Advanced trading with Elliott waves
Don't miss my next trading insight. To receive all my spread betting blog posts by email, as soon as I've written them, just sign up here . If you have any queries regarding MoneyWeek Trader, please contact us here.