The Dow and the euro are at major junctures. Today I will cover the euro, because it has well and truly broken above my tramline, which I showed youlast time.
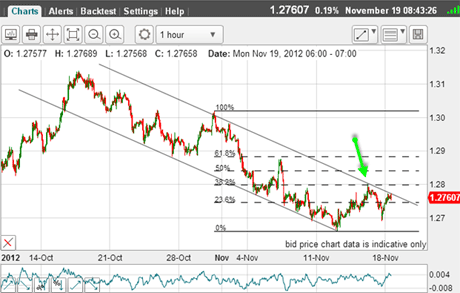
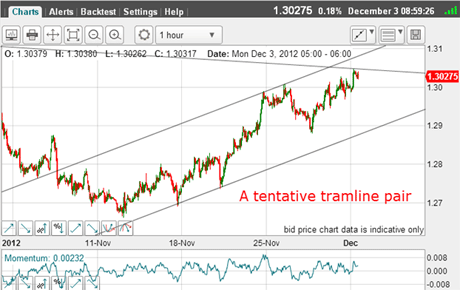
In my 19 November post, the market was backing off the 1.30 level but finding some support in the 1.27 area, and I had my tramlines set on the hourly chart below.
There was one push up to my upper tramline (green arrow) and the market was again testing that line as I signed off that post.
Try 6 free issues of MoneyWeek today
Get unparalleled financial insight, analysis and expert opinion you can profit from.

Sign up to Money Morning
Don't miss the latest investment and personal finances news, market analysis, plus money-saving tips with our free twice-daily newsletter
Don't miss the latest investment and personal finances news, market analysis, plus money-saving tips with our free twice-daily newsletter
I wrote:"But the market is testing this upper line as I write. A punch up through would be interesting!"

(Click on the chart for a larger version)
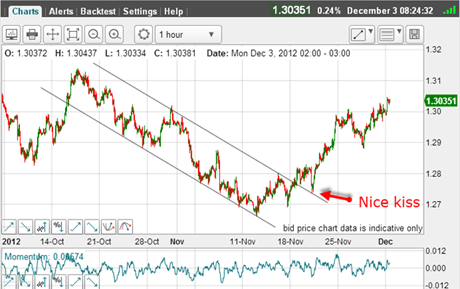
And interesting it certainly was with a major break up this is the situation this morning:
(Click on the chart for a larger version)
The market broke above the tramline and then came back for a farewell kiss before zooming up towards the 1.30 level again.
Remember I was not entirely satisfied with my upper tramline position, as it had only two decent touch points, but the precise kiss back to the line did confirm its position.
Trader tip:When you are uncertain over your tramline, and the market breaks through it, observe action shortly after the break for signs of a pull-back. Here, you could then set a buy order close to the kiss and set your protective stop just below the previous low at 1.2690. A move to this level would invalidate the tramline, and a resumption of the up-move would confirm it.
Danger for the bears
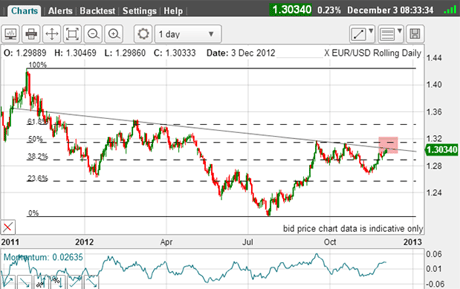
OK, so how does the daily chart look now?
(Click on the chart for a larger version)
I have a very convincing trend line with touch points going back to last year.
Remember, the older the trend line, the more vulnerable it is to a breakdown.
But the market is obviously in the danger zone for the bears. A push above the line would make the 50% Fibonacci level at roughly 1.32 the next target.And the spring highs in the 1.32 1.34 zone look very tempting!
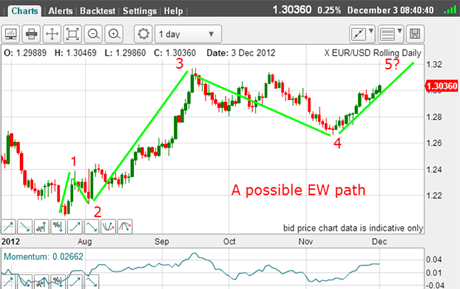
In terms of Elliott waves, I believe I can make a case for these targets, and this is how:
(Click on the chart for a larger version)
From the 24 July low at 1.20, I can see wave 1 up, wave 2 down, the long and strong wave 3 up then an A-B-C wave 4. And if the market can push above the wave 3 high, that would make wave 5 (in the 1.33 area?).
Ideally, I would like to see a negative momentum divergence at the wave 5 high on the daily chart. That would give me a strong indication that a big move down was on the cards.
If this pans out, I would expect a retrace back down to the wave 4 low.
A moment of truth for the euro
But we are in a rally phase, so can I see any tramlines working?
(Click on the chart for a larger version)
I have a good upper line with a nice prior pivot point (PPP), but the lower one leaves a lot to be desired.
However, we are right at the junction between the long-term tramline and the upper one on this hourly chart. This is a moment of truth.
In fact, we are at a very similar juncture in the Dow, and I will cover this market later this week. And in view of the seasonal tendency for stocks to rally in this first week in December, I expect some tramline breaks in both the Dow and the euro.
If you're a new reader, or need a reminder about some of the methods I refer to in my trades, then do have a look at my introductory videos:
The essentials of tramline trading
An introduction to Elliott wave theory
Advanced trading with Elliott waves
Don't miss my next trading insight. To receive all my spread betting blog posts by email, as soon as I've written them, just sign up here . If you have any queries regarding MoneyWeek Trader, please contact us here.