The euro follows my script
The euro has rallied back up to test John C Burford's lower chart tramline. Will it breakthrough, and if so, how high could it go?
Get the latest financial news, insights and expert analysis from our award-winning MoneyWeek team, to help you understand what really matters when it comes to your finances.
You are now subscribed
Your newsletter sign-up was successful
Want to add more newsletters?

Twice daily
MoneyWeek
Get the latest financial news, insights and expert analysis from our award-winning MoneyWeek team, to help you understand what really matters when it comes to your finances.

Four times a week
Look After My Bills
Sign up to our free money-saving newsletter, filled with the latest news and expert advice to help you find the best tips and deals for managing your bills. Start saving today!
Today, I'll follow up on the euro. It shows that to trade effectively, you need to have an idea of where the market is likely to go within the time frame you are working with, so that surprises can be recognised and dealt with.
In myposts, I describe swing trading, where the typical length of time for a trade is measured in hours and days never seconds and minutes, as day traders do. This is important to recognise.
Look at any chart and you will see opposing trends in different time frames. On the ten-minute chart, the trend may be up, while on the daily chart, it may be down. What we do as swing traders is try to find the path of least resistance for the next time period.
MoneyWeek
Subscribe to MoneyWeek today and get your first six magazine issues absolutely FREE

Sign up to Money Morning
Don't miss the latest investment and personal finances news, market analysis, plus money-saving tips with our free twice-daily newsletter
Don't miss the latest investment and personal finances news, market analysis, plus money-saving tips with our free twice-daily newsletter
Very rarely do swing traders concern themselves with factors other than the technical picture. Large macro arguments, or even news events, rarely impinge on our analysis.
Of course, the fundamentals' exist in the background, but the greatest value I obtain from reading market articles is to get a feel of sentiment and importantly, changes in sentiment in the here and now. From this, I can get a handle on which side is weakest the bull or the bear.
For instance, since around ten days ago when many exited long positions in gold, bullish sentiment around gold markedly changed.
Previously unheard-of bearish articles are starting to appear, such as "Why gold is headed for $1,200".
In a recent poll, only 10% of professionals were bullish on gold. I am looking for a point where the market will turn... and I expect a surprise for the bears!
No surprises in the euro...
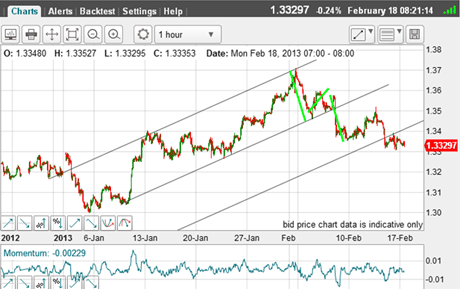
But back to the euro. On Monday, I noted the market had broken my third tramline:

(Click onthe chartfor alarger version)
I also stated: "But for now, it appears the short-term trend is down, but a rally back to the 1.34 area is entirely possible".
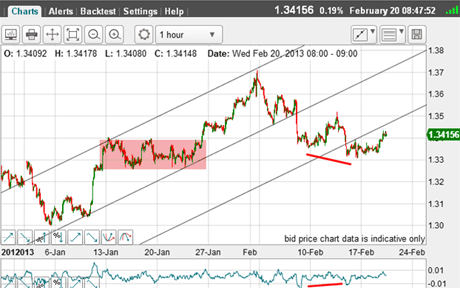
This is the position this morning:

(Click on the chart for a larger version)
The market has indeed moved back up towards the 1.34 area.
Why did I make that forecast? For one thing, on Monday, the market had moved back down into the support area marked by the pink bar.
The bears in this period had to suffer losses as the market rallied out of this zone to the 1.37 area.
So when they saw the market come back to their entry, many grabbed the chance to exit at a much reduced loss or perhaps break-even.
This buying is partly the source of the support that we have seen this week.
And for another, there is a nice positive-momentum divergence (see red bars) a potential bullish sign, as it indicates the selling force is weakening.
And so, as forecast, we are seeing a rally.
Now the market has rallied to the underside of the tramline the moment of truth!
Where to from here?
It will either be repelled around the tramline or it will continue its rally. If the latter, my tramlines will be on shaky ground. Remember, tramlines do not last forever.
And short-term traders will be looking to short on this near-kiss.
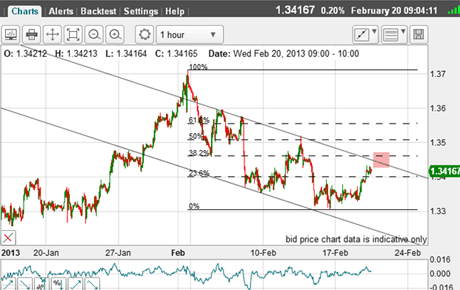
Now we have a decent period of trading off the 1.37 high, can I spot any new tramlines?

(Click on the chart for a larger version)
I have set the Fibonacci retrace levels and the market appears to be heading for the 38% level.
Also, I have a decent tramline pair, although its placement is not 100% certain. I could have drawn it slightly differently.
Today, the market is heading up towards the pink zone. Will it make it?
An upward break of the upper tramline would appear bullish and mark a test of the 50% level.
Very short-term traders would be looking to take profits in this area.
Longer-term traders would be long, adjusting their protective stops to break-even.
I'll follow this market closely to see who wins out.
If you're a new reader, or need a reminder about some of the methods I refer to in my trades, then do have a look at my introductory videos:
The essentials of tramline trading
An introduction to Elliott wave theory
Advanced trading with Elliott waves
Don't miss my next trading insight. To receive all my spread betting blog posts by email, as soon as I've written them, just sign up here . If you have any queries regarding MoneyWeek Trader, please contact us here.
Get the latest financial news, insights and expert analysis from our award-winning MoneyWeek team, to help you understand what really matters when it comes to your finances.
John is is a British-born lapsed PhD physicist, who previously worked for Nasa on the Mars exploration team. He is a former commodity trading advisor with the US Commodities Futures Trading Commission, and worked in a boutique futures house in California in the 1980s.
He was a partner in one of the first futures newsletter advisory services, based in Washington DC, specialising in pork bellies and currencies. John is primarily a chart-reading trader, having cut his trading teeth in the days before PCs.
As well as his work in the financial world, he has launched, run and sold several 'real' businesses producing 'real' products.
-
 Can mining stocks deliver golden gains?
With gold and silver prices having outperformed the stock markets last year, mining stocks can be an effective, if volatile, means of gaining exposure
-
 8 ways the ‘sandwich generation’ can protect wealth
People squeezed between caring for ageing parents and adult children or younger grandchildren – known as the ‘sandwich generation’ – are at risk of neglecting their own financial planning. Here’s how to protect yourself and your loved ones’ wealth.