Your first goal as a trader
Even the best trading methods can't predict with absolute certainty how the market will behave. But they can give you clues, says John C Burford. So, which way now for the euro?
Get the latest financial news, insights and expert analysis from our award-winning MoneyWeek team, to help you understand what really matters when it comes to your finances.
You are now subscribed
Your newsletter sign-up was successful
Want to add more newsletters?

Twice daily
MoneyWeek
Get the latest financial news, insights and expert analysis from our award-winning MoneyWeek team, to help you understand what really matters when it comes to your finances.

Four times a week
Look After My Bills
Sign up to our free money-saving newsletter, filled with the latest news and expert advice to help you find the best tips and deals for managing your bills. Start saving today!
I have written about discipline in trading a few times. That's because I can't stress enough how important it is to stay disciplined and stick to the rules of your trading system.
You see, there are probably as many trading systems as there are traders! I am sure that not many of youwho follow my system do so without adding a few wrinkles of yourown.
And that is all to the good provided it works for you.
MoneyWeek
Subscribe to MoneyWeek today and get your first six magazine issues absolutely FREE

Sign up to Money Morning
Don't miss the latest investment and personal finances news, market analysis, plus money-saving tips with our free twice-daily newsletter
Don't miss the latest investment and personal finances news, market analysis, plus money-saving tips with our free twice-daily newsletter
The method you use is not as important as the discipline in applying it, plus the use of a sound money-management system.
In other words, I would much rather have a mediocre trading method with a tight risk management system than a great method with a weak risk management system.
The other point that many traders fail to grasp is that no trading system has yet been devised that provides a consistent winning formula all of the time. Don't let those seductive ads for proprietary methods fool you.
Yes, a good method will work swimmingly for a while, but then inevitably enters a losing period. That pattern applies to all methods, even mine.
This is where trader discipline comes into play. Do you chuck the method out the window and search for another that promises the earth? Or do you stay with the methods that have worked before?
If the former, you will be forever chasing the rainbow. And you'll lose big money in the process.
So the difference in fallow periods between survival and flame-out comes down to one thing: money management. Keeping your risk and your losses as controlled as possible.
And that is why I recommend, whatever trading system you use, to use my 3% rule and break-even rule. These are two very simple to apply money management rules that can keep you out of serious trouble. That's the first goal for all traders.
The euro breaks my tramline
OK, let's now follow up on the euro story from 8 February, since there have been some interesting developments.
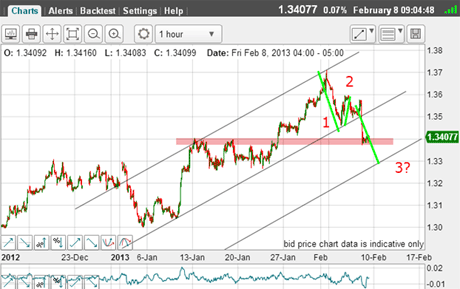
Back then, the market was moving down from my 1.37 target high:

(Click onthe chartfor alarger version)
It had broken my centre tramline and washeading for the lowest tramline.
But it had hit chart support in the pink zone, where I expected a bounce of some kind, and I suggested that it may attempt to rally back to the underside of the centre tramline in a kiss'.
I also suggested we may be in a third wave down with the end of this wave lying on my lower tramline. But that was total speculation at that stage.
Time to abandon this trade?
Of course, the other option was that the current move down was part of a C wave of a possible A-B-C off the 1.37 high.
The implication for this A-B-C interpretation is totally adverse to that from the third wave hypothesis, of course.
If it's a third wave, the move will be down, while if it's an A-B-C, the next move would be up.
In these situations, the only thing we can do is to wait for the market to trace out more movement to confirm one or the other outcome.
Incidentally, that is what we do most of the time in trading. We make an assessment of the likely direction based on our methods, and then wait for confirmation. If none is forthcoming, we can abandon the trade or tighten up stops.
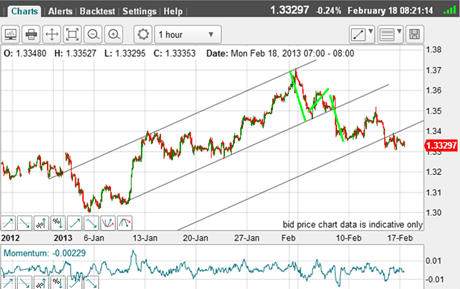
So did the market rally and then descend to the lower tramline?

(Click on the chart for a larger version)
Although I did not get my kiss' on the underside of the centre tramline, the market behaved broadly as I suspected.
The lowest tramline was hit, then broken, and a slight rally back to the underside of this tramline. So I did get my kiss after all but on another tramline!
Hunting for Elliott waves
Also, the pattern off the 1.37 high is not at all a clear A-B-C, since we now have a new low for the move.
In fact, analysing it this morning, there is no clear Elliott wave structure at all. I shall have to wait for further developments in order to delineate an Elliott wave structure on this hourly chart.
But is there a potential Elliott wave pattern developing on the daily chart?

(Click on the chart for a larger version)
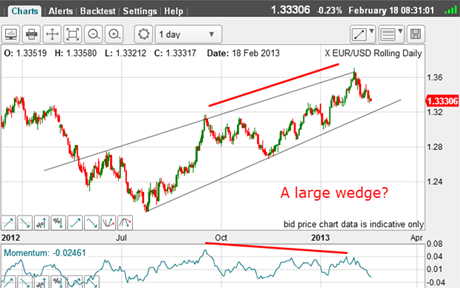
Here is the daily chart going back almost a year. There is a clear A-B-C form to the rally off the 1.20 low, complete with a negative-momentum divergence. This is highly bearish.
On this chart, I can see a clear potential wave 1 down off the recent 1.37 high, then the wave 2 up to last week's rally high, and now a potential wave 3 down or, it could be a C wave in an A-B-C.
If the market declines to my lower trendline, that would be the moment of truth. A break here would confirm the wedge pattern as the ending form. Remember, most rising wedges terminate with a large move down.
But for now, it appears the short-term trend is down, but a rally back to the 1.34 area is entirely possible.
If you're a new reader, or need a reminder about some of the methods I refer to in my trades, then do have a look at my introductory videos:
The essentials of tramline trading
An introduction to Elliott wave theory
Advanced trading with Elliott waves
Don't miss my next trading insight. To receive all my spread betting blog posts by email, as soon as I've written them, just sign up here . If you have any queries regarding MoneyWeek Trader, please contact us here.
Get the latest financial news, insights and expert analysis from our award-winning MoneyWeek team, to help you understand what really matters when it comes to your finances.
John is is a British-born lapsed PhD physicist, who previously worked for Nasa on the Mars exploration team. He is a former commodity trading advisor with the US Commodities Futures Trading Commission, and worked in a boutique futures house in California in the 1980s.
He was a partner in one of the first futures newsletter advisory services, based in Washington DC, specialising in pork bellies and currencies. John is primarily a chart-reading trader, having cut his trading teeth in the days before PCs.
As well as his work in the financial world, he has launched, run and sold several 'real' businesses producing 'real' products.
-
 Average UK house price reaches £300,000 for first time, Halifax says
While the average house price has topped £300k, regional disparities still remain, Halifax finds.
-
 Barings Emerging Europe trust bounces back from Russia woes
Barings Emerging Europe trust has added the Middle East and Africa to its mandate, delivering a strong recovery, says Max King