The Dow rallies to a new high – what now?
John Burford is reminded that there's no such thing as a sure thing in the markets as the Dow Jones rallies to a new high. But the charts indicate a reversal could still be on the cards.
Get the latest financial news, insights and expert analysis from our award-winning MoneyWeek team, to help you understand what really matters when it comes to your finances.
You are now subscribed
Your newsletter sign-up was successful
Want to add more newsletters?

Twice daily
MoneyWeek
Get the latest financial news, insights and expert analysis from our award-winning MoneyWeek team, to help you understand what really matters when it comes to your finances.

Four times a week
Look After My Bills
Sign up to our free money-saving newsletter, filled with the latest news and expert advice to help you find the best tips and deals for managing your bills. Start saving today!
Yesterday I laid out a reasonably strong case for last Thursday's high at 12,920 to be the top of the incredible Dow rally off the October low at 10,400.
I showed a convincing minor five-wave Elliott wave pattern off Thursday's high, an extreme in investor bullishness (which normally coincides with tops), and a large-scale rising wedge, which normally resolves downwards.
In previous articles, I also showed that the recovery off the October low looks much more a classic A-B-C pattern than anything else. As we know, these three-wave patterns are corrective to the main trend, which is down.
MoneyWeek
Subscribe to MoneyWeek today and get your first six magazine issues absolutely FREE

Sign up to Money Morning
Don't miss the latest investment and personal finances news, market analysis, plus money-saving tips with our free twice-daily newsletter
Don't miss the latest investment and personal finances news, market analysis, plus money-saving tips with our free twice-daily newsletter
Why yesterday's rally cancels my Elliott wave signal
In yesterday's article, I stated that a resolution out of the wedge would be either a move well above the 12,920 top to break the upper trendline, or a break of the lower trendline.
Overnight, the market rallied to take out the 12,920 level (high so far this morning on my spread betting platform is 12,940, so only a small move above that level).
That means my pretty Elliott wave signal is cancelled most emphatically.
This just proves that there is no such thing in the markets as a sure thing'.They are probabilistic and my job (as yours as a trader should be) is to identify high-probability low-risk entries. And using my 3% rule and break-even rule can help minimise my losses on losing trades.
But does this new high mean I am totally wrong to look for a top around current levels? Let's take a look.
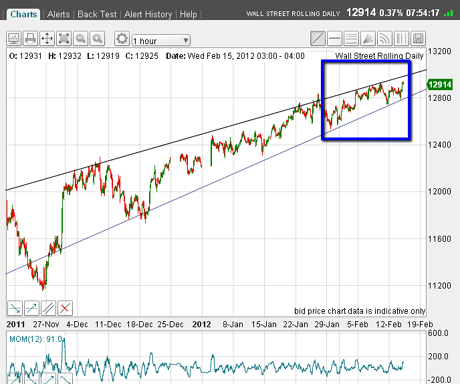
Here is the updated chart showing the market in relation to the wedge boundaries I showed you yesterday:

Focus on the blue box. As you can see, although the market has made a slight new high, it is still well within the bounds. That means the eventual move out of it could still be to the downside.
The negative factors I mentioned earlier still hold, so despite my loss on that trade, I shall be still looking for a top soon. And I think it may come sooner rather than later and here is why.
This could be the final wave up before a reversal

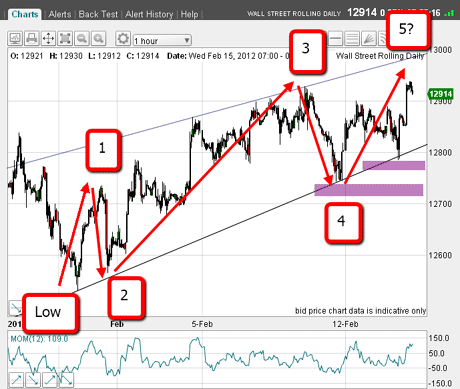
This shows the action since the minor low of 30 January (highlighted in the blue box in the first chart). I can count a very nicely proportioned five-wave pattern complete with a long and strong' third wave with the fifth wave forming this morning.
The implication, of course, is that if correct, the fifth wave would be the final up wave and lead to a reversal down.
Now, the final top of this fifth wave may still lie ahead and it could reach as far as the upper wedge line at the 13,000 area without violating this pattern.
But if the market falls to the area of the purple bars, which lie at or below the lower wedge trendline, that would confirm the market had finally turned.
If these levels can be broken, I would expect a very rapid decline immediately.
Why I'm waiting on the sidelines, ready to pounce
As we are seeing, stock market tops are usually drawn-out affairs unlike markets such as gold, silver, crude oil and currencies, which can be spiky'. With stocks, it is usually necessary to make several attempts to jump on board.
But I'm convinced the glittering prize is awaiting me. I need just a little more patience. I know that when the market is holding up longer than I would like, it is very tempting to throw in the towel, as several prominent US bears have recently done.
There has been a surge in bullish consensus recently and I'm sure many bears who have changed their stance have helped pump up the numbers!
I have been around the markets long enough to know that this is the very time to hold my nerve and to trust my reading of the market. Even though I know some traders' emotions would be telling them to abandon ship!
I know that as a trader, I have the luxury of being able to stand aside, waiting for the very best time to enter. And that's why I am on the sidelines without a position, but waiting to pounce.
If you're a new reader, or need a reminder about some of the methods I refer to in my trades, then do have a look at my introductory videos:
The essentials of tramline trading
An introduction to Elliott wave theory
Advanced trading with Elliott waves
Don't miss my next trading insight. To receive all my spread betting blog posts by email, as soon as I've written them, just sign up here .
Get the latest financial news, insights and expert analysis from our award-winning MoneyWeek team, to help you understand what really matters when it comes to your finances.
John is is a British-born lapsed PhD physicist, who previously worked for Nasa on the Mars exploration team. He is a former commodity trading advisor with the US Commodities Futures Trading Commission, and worked in a boutique futures house in California in the 1980s.
He was a partner in one of the first futures newsletter advisory services, based in Washington DC, specialising in pork bellies and currencies. John is primarily a chart-reading trader, having cut his trading teeth in the days before PCs.
As well as his work in the financial world, he has launched, run and sold several 'real' businesses producing 'real' products.
-
 Average UK house price reaches £300,000 for first time, Halifax says
While the average house price has topped £300k, regional disparities still remain, Halifax finds.
-
 Barings Emerging Europe trust bounces back from Russia woes
Barings Emerging Europe trust has added the Middle East and Africa to its mandate, delivering a strong recovery, says Max King