I have been neglecting the stock market indexes of late, what with the noteworthy action in gold and the euro. But I thought I would draw your attention to the very interesting situation in the Dow this morning before the markets opened.
The rally this week to the 12,400 area has carried it to a point where three tramlines meet. This should provide strong resistance to further advances.
To set the scene, here is the long-term picture:
Try 6 free issues of MoneyWeek today
Get unparalleled financial insight, analysis and expert opinion you can profit from.

Sign up to Money Morning
Don't miss the latest investment and personal finances news, market analysis, plus money-saving tips with our free twice-daily newsletter
Don't miss the latest investment and personal finances news, market analysis, plus money-saving tips with our free twice-daily newsletter
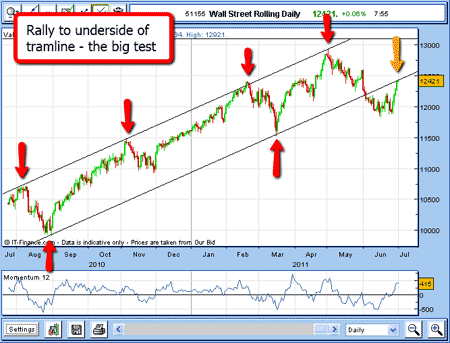
This is the past year's action, and the big waves have been confined to my tramlines quite beautifully until the big break a month ago.

But now, the market has rallied towards the underside of my lower tramline. This is a normal action after a tramline break, I have given many examples in my previous emails.
As I write, the market is testing the 12,400 level, which is right on my tramline.
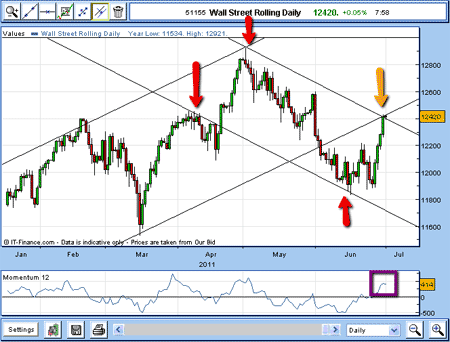
Let's zoom in on a closer scale.
(Click on the chart for a larger version)
Now I can draw another pair of tramlines this time, they are down-sloping. The key highs and lows I have marked with red arrows.
Now the market is testing the upper tramline, where it meets the up-trending lower tramline (marked with yellow arrow).
A really great tramline is revealed
The week's rally has been sharp, so let's look at that in detail on the hourly chart:
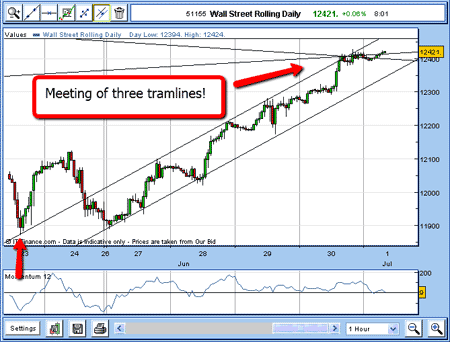
I start looking for a tramline using the important low (red arrow), and I can draw a line right across all the tops made this week.
That looks really good.
Now I use the parallel line tool on my spread betting platform and find I can draw a tramline right across the week's lows. That is a pretty picture.
But look at the where the market has reached the point where my three tramlines meet.
This should provide at least some stiff resistance. But there is one more piece to the puzzle provided by our old friend Mr Fibonacci.
As you know, I always keep an eye on Fibonacci retracements of previous waves, as they have proven time and time again to be very accurate points of support and resistance.
I have given many examples in my emails of markets turning at Fibonacci points. Maybe this will be another one!
Here is the Fibonacci picture for the previous wave made from the 1 June high to the 15 June low:
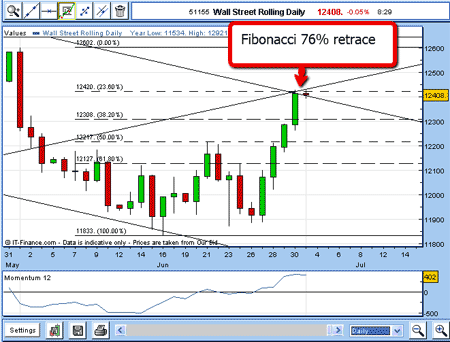
The rally to the 12,400 level is right to the Fibonacci 76% retrace.
12,400 is a strong resistance level
So now we have very strong evidence from several fronts that the 12,400 level will be very difficult to overcome and the momentum is reaching into overbought territory (marked by purple box in my second chart).
As we all know, there are no guarantees in the markets, and even strong evidence such as I have here can be swept aside.
As traders, all we can do is assess the evidence and act accordingly, placing sensible protective stops just in case we are wrong.
Remember, never get married to a strong view on the markets divorce can be painful!
Monday is Independence Day holiday in the US, but I shall probably know by Wednesday whether the resistance will hold.
NB: Don't miss my next trading insight. To receive all my spread betting blog posts by email, as soon as I've written them, just sign up here .