The Dow is overheating
With so much bullish sentiment driving the Dow higher, the eventual fall will be dramatic. Here, John C Burford looks to the charts to forecast when it might happen.
Get the latest financial news, insights and expert analysis from our award-winning MoneyWeek team, to help you understand what really matters when it comes to your finances.
You are now subscribed
Your newsletter sign-up was successful
Want to add more newsletters?

Twice daily
MoneyWeek
Get the latest financial news, insights and expert analysis from our award-winning MoneyWeek team, to help you understand what really matters when it comes to your finances.

Four times a week
Look After My Bills
Sign up to our free money-saving newsletter, filled with the latest news and expert advice to help you find the best tips and deals for managing your bills. Start saving today!
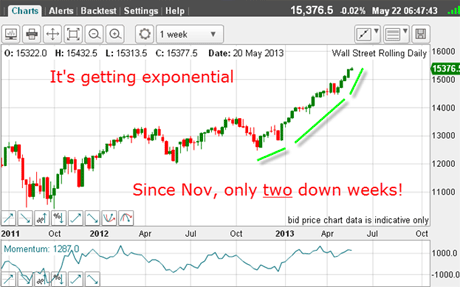
What an amazing stock market! New highs are an almost daily occurrence. And since November, there have been only two down weeks:

(Click on the chart for a larger version)
Am I the only one to find this reminiscent of the one-way situation in gold in 2011, as it zoomed up to its $1,920 top in an exponential blow-off?
MoneyWeek
Subscribe to MoneyWeek today and get your first six magazine issues absolutely FREE

Sign up to Money Morning
Don't miss the latest investment and personal finances news, market analysis, plus money-saving tips with our free twice-daily newsletter
Don't miss the latest investment and personal finances news, market analysis, plus money-saving tips with our free twice-daily newsletter
The comparisons are eerily similar.
We have record-high bullishness in the hedge fund camp (see Monday's article for the commitments of traders figures). We have massive complacency a sense that there is nothing to worry about, as the Bernanke Put' will guarantee a continually rising market.
And we have, supposedly, a 'wall of money' just itching to switch from US money market funds into equities by private investors who have been suspicious of the rally, so far. That, plus the continued blast of money from quantitative easing (QE) rushing into stocks.
Right now, 23% (and growing) of the world's central banks are buying equities, as are US bond funds, who aresupposed to be prevented from investing outside of fixed interest!.
Hey - everybody is buying! My dog should be buying!
I'm sure I do not have to remind anyone that with gold in 2011, the massive money-printing debasement was going to produce hyperinflation, and to protect wealth, owning gold was the no-brainer play. Well, we all know how that turned out.
At such manic times as this in stocks, I am reminded of Joe Granville's famous maxim: "When something seems obvious to everyone, it is obviously wrong".
The bulls paint a Goldilocks picture the economy is not too hot and not too cold where good news is good and bad news is even better! The bad economic data means that the Fed will keep pumping up stocks with liquidity. After all, as one money manager said: "The stock market is the last game in town".
But as we saw with gold in 2011, that story works on the way up, but fails miserably on the way down. In gold, what broke the back of the bull market was the realisation that hyperinflation was a mirage. The market was crowded on the long side at the top, and the forced long liquidation as reality dawned drove it down with some major panic selling.
Can we expect a similar outcome for shares, since this market is also over-crowded on the long side by the specs?
As a bear, I am always looking for a turn. One reason is that with such an unbalanced market, the next bear market will be very strong to the downside.
Remember, markets fall out of the window faster than they climb the stairs.
Are we close to a top?
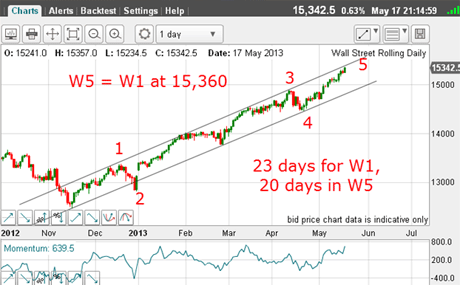
In addition, I suggested that a time equality would place the top at mid-week.
Today is mid-week, so let's see how my rather left-field forecast is working out.
This was my chart on Monday:

(Click on the chart for a larger version)
Last night, the Dow pushed up to a high of 15,432 a good 70 pips above this target. Given that long and strong rallies can often overshoot targets, this is a pretty close hit as it is only 0.45% away from ideal.
But can I fine-tune a better top target?
I believe I can and it comes from a closer look at the last wave sequence of the rally:
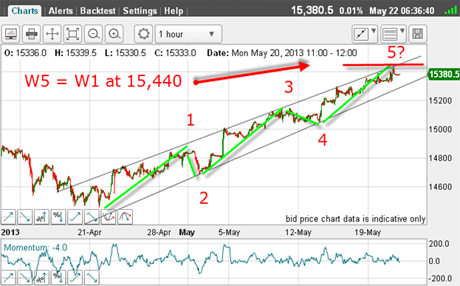
Here is the hourly chart of the wave 5 shown above:

(Click on the chart for a larger version)
This fifth wave also contains a five-wave sequence of one smaller degree!
And applying the same equality of waves 1 and 5. I get a wave 5 target at 15,440.
The high reached yesterday was two pips shy of this. Hmmm.
Note the above sequence is contained within a wedge. This could be important!
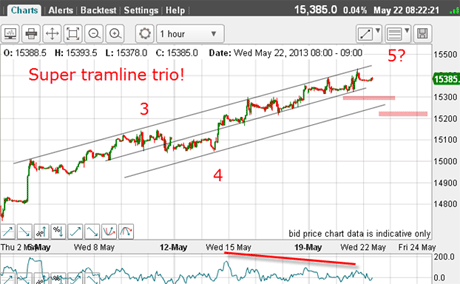
And for an even closer look, let's examine these smaller fourth and fifth waves:

(Click on the chart for a larger version)
From early May, my upper tramline sports an impressive number of exact touch points with yesterday's high being the seventh.
At no time has the market traded above this line it is solid resistance (so far).
And from the wave 4 low, the market has followed the trading channel between the two upper tramlines. This means that a break of the centre tramline should be significant and give me the first sign that the turn has started.
A more decisive event would be a break of the lower tramline. And if we really do have a top in place, a break of the wave 4 low at 15,050 should clinch it.
From the many articles, blogs and research notes that I read, the overwhelming opinion is that we are overdue a correction, but that would be a major opportunity to buy more equities. Received wisdom is that stocks are heading much higher this year after a correction.
Investors played that game in gold after the 2011 top, buying the dips. This did not work out too well and perhaps stock investors will get the same experience.
OK, if we do have a turn at hand, what are the other signs that it is a genuine turn?
Using Elliott waves again, a signal I will be watching for is a 5-wave sequence down on a small scale with all of the correct characterisitics, such as a long and strong third wave and a positive-momentum divergence at the fifth wave low.
The turn may not occur here, but when it does it should be very sharp because the boat is badly listing to the bullish side. And I have my usual trading methods to deploy when that time arrives.
If you're a new reader, or need a reminder about some of the methods I refer to in my trades, then do have a look at my introductory videos:
The essentials of tramline trading Advanced tramline trading An introduction to Elliott wave theory Advanced trading with Elliott waves Trading with Fibonacci levels Trading with 'momentum' Putting it all together
Don't miss my next trading insight. To receive all my spread betting blog posts by email, as soon as I've written them, just sign up here . If you have any queries regarding MoneyWeek Trader, please contact us here.
Get the latest financial news, insights and expert analysis from our award-winning MoneyWeek team, to help you understand what really matters when it comes to your finances.
John is is a British-born lapsed PhD physicist, who previously worked for Nasa on the Mars exploration team. He is a former commodity trading advisor with the US Commodities Futures Trading Commission, and worked in a boutique futures house in California in the 1980s.
He was a partner in one of the first futures newsletter advisory services, based in Washington DC, specialising in pork bellies and currencies. John is primarily a chart-reading trader, having cut his trading teeth in the days before PCs.
As well as his work in the financial world, he has launched, run and sold several 'real' businesses producing 'real' products.
-
 Average UK house price reaches £300,000 for first time, Halifax says
While the average house price has topped £300k, regional disparities still remain, Halifax finds.
-
 Barings Emerging Europe trust bounces back from Russia woes
Barings Emerging Europe trust has added the Middle East and Africa to its mandate, delivering a strong recovery, says Max King