The Dow hits my major tramline
Recent support is leading the Dow Jones to hit John C Burford’s upper target. Here, he looks at the charts to prepare for some counter-trend traders.
Get the latest financial news, insights and expert analysis from our award-winning MoneyWeek team, to help you understand what really matters when it comes to your finances.
You are now subscribed
Your newsletter sign-up was successful
Want to add more newsletters?

Twice daily
MoneyWeek
Get the latest financial news, insights and expert analysis from our award-winning MoneyWeek team, to help you understand what really matters when it comes to your finances.

Four times a week
Look After My Bills
Sign up to our free money-saving newsletter, filled with the latest news and expert advice to help you find the best tips and deals for managing your bills. Start saving today!
With support coming in to the Dow, the euro and gold, many of my upper targets are being hit this week. This is always very exciting, as I prepare for counter-trend trades.
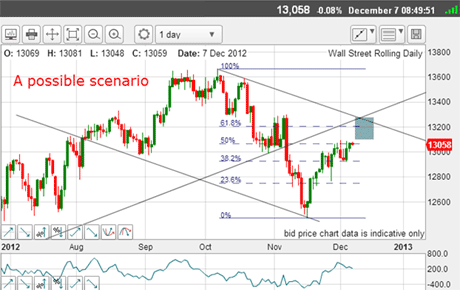
So let's continue with the Dow from 7 December. This was my chart then:

(Click on the chart for a larger version)
MoneyWeek
Subscribe to MoneyWeek today and get your first six magazine issues absolutely FREE

Sign up to Money Morning
Don't miss the latest investment and personal finances news, market analysis, plus money-saving tips with our free twice-daily newsletter
Don't miss the latest investment and personal finances news, market analysis, plus money-saving tips with our free twice-daily newsletter
The up-sloping line is my trend line off the October 2011 low, while my down-sloping tramline pair is my suggested scenario.
Back then, these lines had very little going for them very few touch points, in fact. So I needed to be alert to making modifications.
As I write this morning, the market has moved up from last Friday and into the blue zone, which means that my label "a possible scenario" should now read: "the current scenario"!
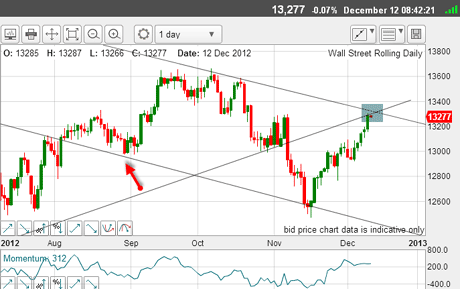
I have taken another look at the tramline pair and believe I have a slightly better placement:

(Click on the chart for a larger version)
The lower line now sports an early touch point (red arrow), as well as the prior pivot point. I have taken it through the plunge low of 16 November as I consider that to be a throw-over after a rapid plunge.
Remember, a sharp move and reversal can overshoot valid tramlines, and it is OK to cut off the pigtails, as I did here.
This places the blue zone target at the crossing of the upper tramline and the underside of my long-term trend line.
This is a moment of truth, as resistance here should be very tough to break.
Also remember we are in wave 2 up, which could end at any time, bearing in mind that upward retracements in the Dow have historically been deep sometimes, very deep.
This means I am on the lookout for a top in the Dow. Can another related market yield any clues?
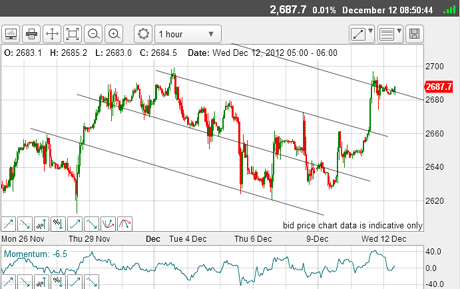
Here is the Nasdaq, which has been noticeably weaker in the current rally than the Dow:

(Click on the chart for a larger version)
Remember, the Nasdaq index consists of smaller tech-focused companies and is considered much higher-risk than the large-cap Dow.
Here, I have drawn in my tramlines. Right away, it has reached my fourth tramline and is currently battling with the same selling forces that are operating in the Dow.
So, both indexes are at major resistance.
Now, I do keep an eye on the economic calendar, and today, the Fed will announce their deliberations from the current monthly meeting. Expectations are that The Fed will switch from buying the usual Treasuries to alternative assets', and this has been buoying stocks in anticipation.
Recently, the US dollar has been sold ahead of the meeting, as today's announcement is expected to be bearish for the dollar. Also, Treasury bond yields have jumped ominously.
The market pays close attention to Fed statements, of course, and trading around release of news can be very volatile.
So, f you are an active trader, I recommend you follow the US economic calendar on Bloomberg.com.
This morning, I have decided to remain on my hands for this reason. But if I see a spike up following the Fed news, I may look at this as another opportunity to fade it.
If you're a new reader, or need a reminder about some of the methods I refer to in my trades, then do have a look at my introductory videos:
The essentials of tramline trading
An introduction to Elliott wave theory
Advanced trading with Elliott waves
Don't miss my next trading insight. To receive all my spread betting blog posts by email, as soon as I've written them, just sign up here . If you have any queries regarding MoneyWeek Trader, please contact us here.
Get the latest financial news, insights and expert analysis from our award-winning MoneyWeek team, to help you understand what really matters when it comes to your finances.
John is is a British-born lapsed PhD physicist, who previously worked for Nasa on the Mars exploration team. He is a former commodity trading advisor with the US Commodities Futures Trading Commission, and worked in a boutique futures house in California in the 1980s.
He was a partner in one of the first futures newsletter advisory services, based in Washington DC, specialising in pork bellies and currencies. John is primarily a chart-reading trader, having cut his trading teeth in the days before PCs.
As well as his work in the financial world, he has launched, run and sold several 'real' businesses producing 'real' products.
-
 MoneyWeek Talks: The funds to choose in 2026
Podcast Fidelity's Tom Stevenson reveals his top three funds for 2026 for your ISA or self-invested personal pension
-
 Three companies with deep economic moats to buy now
Opinion An economic moat can underpin a company's future returns. Here, Imran Sattar, portfolio manager at Edinburgh Investment Trust, selects three stocks to buy now