The Dow has hit my target – what now?
The Dow's been on a roll. But where will it go from here? John C Burford uses his Fibonacci trading methods to find out.
Get the latest financial news, insights and expert analysis from our award-winning MoneyWeek team, to help you understand what really matters when it comes to your finances.
You are now subscribed
Your newsletter sign-up was successful
Want to add more newsletters?

Twice daily
MoneyWeek
Get the latest financial news, insights and expert analysis from our award-winning MoneyWeek team, to help you understand what really matters when it comes to your finances.

Four times a week
Look After My Bills
Sign up to our free money-saving newsletter, filled with the latest news and expert advice to help you find the best tips and deals for managing your bills. Start saving today!
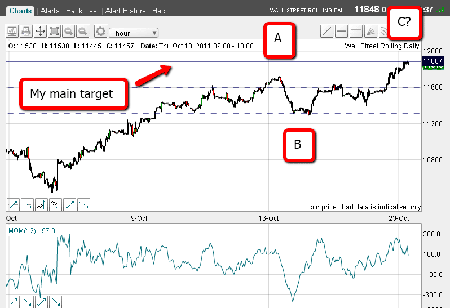
If you have been following my commentary on the Dow, I have been calling for an extension of the strong rally off the 4 October low and the market has followed my script.
We even have an A-B-C formation, for which I had been hoping, which was put in last week here is the chart showing this three-wave A-B-C:

(Clickon thechartfor a larger version)
MoneyWeek
Subscribe to MoneyWeek today and get your first six magazine issues absolutely FREE

Sign up to Money Morning
Don't miss the latest investment and personal finances news, market analysis, plus money-saving tips with our free twice-daily newsletter
Don't miss the latest investment and personal finances news, market analysis, plus money-saving tips with our free twice-daily newsletter
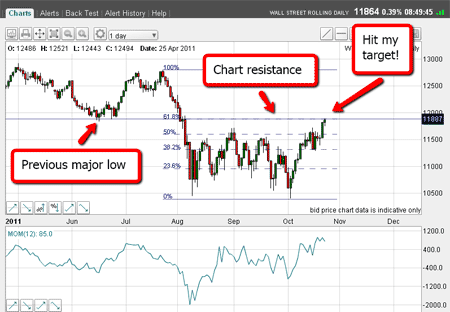
In my last post, I placed my main target at the 11,900 area. This is the confluence of the 62% Fibonacci retrace of the wave from the 22 July high and the 4 October low and the chart resistance level (see chart below). Recall the market completed the fifth Elliott wave down from the 2 May high at 12,900 at the 4 October low.
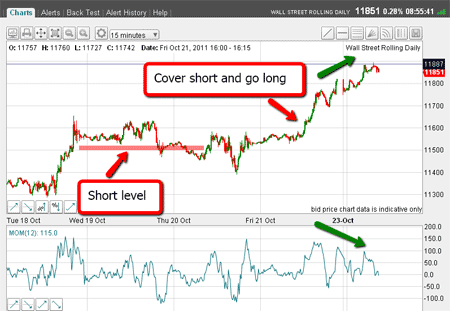
Last week, I had two possible short-term scenarios and the rally continuation one won out. I said that if the market could fall below my support zone, a short trade was indicated.

(Click on the chart for a larger version)
I did indeed get my short trade off on my sell-stop, but when the market failed to follow through, I covered quickly and went long. Because I did not want to hold it over the weekend (when anything can happen), I sold my position at Friday's close for a nice net gain.
Let's recap why I am using these Fibonacci retracements levels to guide my trading.
View my video tutorials to see how I use Fibonacci in my trading.
The bear market rally high of 12,800 on 22 July is the obvious choice for the high pivot, since the wave down from there was sharp and unequivocal.
The low pivot is quite clearly the 4 October low, as the rally from that point is also sharp and unequivocal and is the most recent major low.
Trader Tip: At some point, these Fibonacci retracement levels cease being useful for trade timing, and it is impossible to forecast when this might happen. But for now, with the low being about only three weeks ago, my guess is that they are still operative. But be prepared for surprises!
Now that the market has risen above the top high of the August-September consolidation period, I can say that this rally has now taken out the buy-stops placed there by short traders who placed their bets in the summer.
This forced short covering buying has resulted in the sharp moves we have seen. So, as of this morning, here is the updated daily chart:
This morning, the market has already touched the target line at 11,890 (we must allow some leeway in setting targets):

(Click on the chart for a larger version)
Note the possible negative momentum divergence marked by the green arrows, which is a feature I always like to see if I am looking for tops.
Now, I am not getting too excited just yet because we have seen a very vigorous rally off the 4 October low, and from experience, this type of rally can often overshoot targets by a wide margin.
Placing a short trade here could result in being stopped out on a 3% rule protective stop. But we are getting very close to making those short trades.
A long-term bearish trader will be looking to start scaling-up short sales from this point. This is a technique some professionals use to build a substantial position.
Briefly, it involves determining your final position size first. Then allocate progressively larger size bets as the market rises to where you have reached your planned total position size. This is a very sophisticated technique, and I do not recommend it for the average spread-better!
But we have a time-certain event coming up on Wednesday that is sure to affect the markets. It is the announced date when the plan to solve the eurozone debt crisis that the politicians have promised will be revealed.
Because so much of the current rally is being predicated on the hope that this plan will be bullish, there is huge scope for disappointment.
Note the "overbought" momentum reading on the daily chart a sign that anything less than a very bullish outcome would tip the odds hugely in favour of a decline.
Short-term traders will be shorting into this rally, of course.
At this point, I am not able to see any tramlines that could help in my trade timing, so I am going on the Fibonacci and chart support inputs for now.
But I shall be keeping a sharp eye on market movements over the next few days.
In my next email, I hope to cover the EUR/USD, which continues to offer great short-term profitable trades.
If you're a new reader, or need a reminder about some of the methods I refer to in my trades, then do have a look at my introductory videos:
The essentials of tramline trading
An introduction to Elliott wave theory
Don't miss my next trading insight. To receive all my spread betting blog posts by email, as soon as I've written them, just sign up here .
Get the latest financial news, insights and expert analysis from our award-winning MoneyWeek team, to help you understand what really matters when it comes to your finances.
John is is a British-born lapsed PhD physicist, who previously worked for Nasa on the Mars exploration team. He is a former commodity trading advisor with the US Commodities Futures Trading Commission, and worked in a boutique futures house in California in the 1980s.
He was a partner in one of the first futures newsletter advisory services, based in Washington DC, specialising in pork bellies and currencies. John is primarily a chart-reading trader, having cut his trading teeth in the days before PCs.
As well as his work in the financial world, he has launched, run and sold several 'real' businesses producing 'real' products.
-
 How should a good Catholic invest? Like the Vatican’s new stock index, it seems
The Vatican Bank has launched its first-ever stock index, championing companies that align with “Catholic principles”. But how well would it perform?
-
 The most single-friendly areas to buy a property
There can be a single premium when it comes to getting on the property ladder but Zoopla has identified parts of the UK that remain affordable if you aren’t coupled-up