How to play extreme volatility in the Dow
With the Dow zigging and zagging, many traders will have been caught out. But John C Burford is staying out of harm's way and watching the charts to plot his next entry point.
Get the latest financial news, insights and expert analysis from our award-winning MoneyWeek team, to help you understand what really matters when it comes to your finances.
You are now subscribed
Your newsletter sign-up was successful
Want to add more newsletters?

Twice daily
MoneyWeek
Get the latest financial news, insights and expert analysis from our award-winning MoneyWeek team, to help you understand what really matters when it comes to your finances.

Four times a week
Look After My Bills
Sign up to our free money-saving newsletter, filled with the latest news and expert advice to help you find the best tips and deals for managing your bills. Start saving today!
As I expected, the markets are being zigged and zagged by the wide swings in traders emotions induced by the news (and non-news) emanating from the G20 conflab on how to save the world (again).
I have my views but they don't matter when trading. It is the markets that count.
This morning, I will focus on the Dow.
MoneyWeek
Subscribe to MoneyWeek today and get your first six magazine issues absolutely FREE

Sign up to Money Morning
Don't miss the latest investment and personal finances news, market analysis, plus money-saving tips with our free twice-daily newsletter
Don't miss the latest investment and personal finances news, market analysis, plus money-saving tips with our free twice-daily newsletter
In my last post, the Dow was in a vigorous counter-trend rally that was on the verge of taking out the buy-stops placed just above the August-September highs.
I had been expecting a move to above the 11,700 area, which was the highest high in the August-September period. That would be the last area where significant buy-stops were sitting.
And on Monday, the rally carried precisely to the 11,700 level. How pretty.
But that is where the market fell heavily, losing 400 pips in just a few hours.
But late yesterday, the market rallied again and was up around 300 pips near the close.
Now that's what I call volatility.
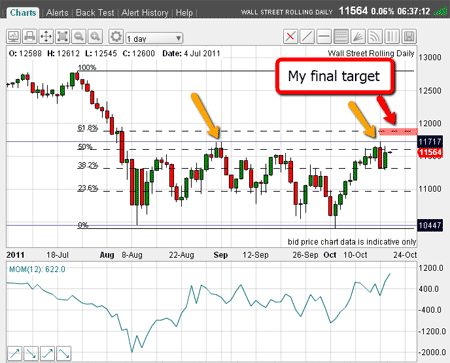
Here is the daily chart showing this action:
(Click on the chart for a larger version)
I have indicated the two 11,700 highs with yellow arrows, and have drawn two solid horizontal lines bounding the extremes of trading since August.
My final target is shown by the purple bar at the 11,900 area. Will it make it?
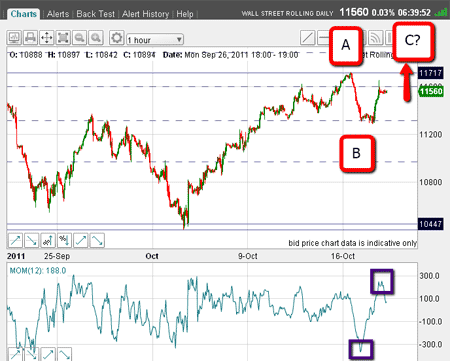
For that, I need to examine the finer structure of the action. Here is the hourly chart:
(Click on the chart for a larger version)
Proving the high volatility, I have marked the extreme momentum readings with purple boxes. These extremes occurred within hours of each other. That is some zig-zag!
Recall from previous emails that I would prefer to see an A-B-C pattern on this rally, as it would likely presage a huge move down. As of Friday's close, there was no sign of the A wave topping out. But with the 400-pip dip this week, I may have my A and my B waves (as marked).
If I am correct, I can expect a rally to new highs in the 11,900 area.
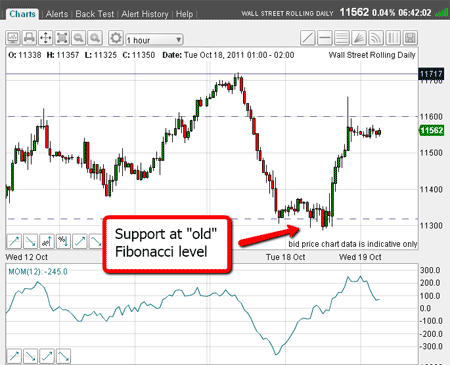
Here is a close-up of recent action:
(Click on the chart for a larger version)
Interestingly, the dip to wave B took it right to the 38% Fibonacci level drawn off the 22 July high and the 4 October low! How can an old' Fibonacci level be significant for support during a new' wave? The answer is old' Fibonacci levels are used for upper targets, not lower ones.
There is order in the markets. As traders, it is our job to find it and then exploit it.
Also note yesterday's rally it created a spike'. That is impulsive action and usually portends more upside. If so, that would support my case for a C wave ahead.
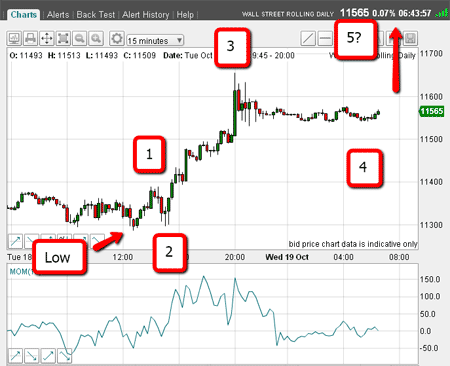
Here are my Elliott Wave ideas on the 15-min chart:
(Click on the chart for a larger version)
From yesterday's low, I can count waves 1,2,3, and 4. Look at wave 3 (containing the spike); it has all the hallmarks of a classic third wave long and strong.
If the market can rally above wave 3, that would confirm my count. We should then be off to challenge the 11,700 level (for the third time, which is usually lucky).
If this occurs, I shall be waiting with powder dry to look to short in this area.
But if my count is wrong, I have an alternative count:
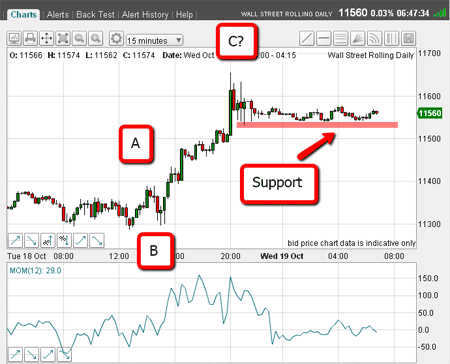
(Click on the chart for a larger version)
I can count waves A and B and if my wave 3 is actually a C wave, the market will head down from here. It all depends on whether the support (marked by pink bar) will hold. Remember, A-B-C waves are corrective to the main trend which, in this case, would be down.
But if the market can break this support, the odds would then favour a decline.
Placing short sell orders just below support and entering protective stops just above recent trading would be a possible trade.
If this trade is touched, I would be looking for a swift move down. But if that did not materialise, I would be looking to exit the trade.
But with volatility extremely high, I still expect wide swings and short-term trading to remain the style of choice for now.
If you're a new reader, or need a reminder about some of the methods I refer to in my trades, then do have a look at my introductory videos:
The essentials of tramline trading
An introduction to Elliott wave theory
Don't miss my next trading insight. To receive all my spread betting blog posts by email, as soon as I've written them, just sign up here .
Get the latest financial news, insights and expert analysis from our award-winning MoneyWeek team, to help you understand what really matters when it comes to your finances.
John is is a British-born lapsed PhD physicist, who previously worked for Nasa on the Mars exploration team. He is a former commodity trading advisor with the US Commodities Futures Trading Commission, and worked in a boutique futures house in California in the 1980s.
He was a partner in one of the first futures newsletter advisory services, based in Washington DC, specialising in pork bellies and currencies. John is primarily a chart-reading trader, having cut his trading teeth in the days before PCs.
As well as his work in the financial world, he has launched, run and sold several 'real' businesses producing 'real' products.
-
 Can mining stocks deliver golden gains?
With gold and silver prices having outperformed the stock markets last year, mining stocks can be an effective, if volatile, means of gaining exposure
-
 8 ways the ‘sandwich generation’ can protect wealth
People squeezed between caring for ageing parents and adult children or younger grandchildren – known as the ‘sandwich generation’ – are at risk of neglecting their own financial planning. Here’s how to protect yourself and your loved ones’ wealth.