The Dow breaks sharply lower – what to do now
The Dow's recent plunge will have caught out many traders, says John C Burford. So, can we expect the market to bounce? And how high could it go?
Get the latest financial news, insights and expert analysis from our award-winning MoneyWeek team, to help you understand what really matters when it comes to your finances.
You are now subscribed
Your newsletter sign-up was successful
Want to add more newsletters?

Twice daily
MoneyWeek
Get the latest financial news, insights and expert analysis from our award-winning MoneyWeek team, to help you understand what really matters when it comes to your finances.

Four times a week
Look After My Bills
Sign up to our free money-saving newsletter, filled with the latest news and expert advice to help you find the best tips and deals for managing your bills. Start saving today!
With hugely significant developments in all markets I have recently followed from the EUR/USD to the FTSE to Barclays to the Dow to the Nikkei I am swamped with possibilities to cover today.
But the most interesting is the Dow. Because this market is offering some terrific examples of how my tramlines can help me predict targets and also give me excellent low-risk entries.
Yesterday, I showed how the Nikkei is trading along my multi-year tramlines and how I arrived at my major downside target, which I set in the 8,000 region.
MoneyWeek
Subscribe to MoneyWeek today and get your first six magazine issues absolutely FREE

Sign up to Money Morning
Don't miss the latest investment and personal finances news, market analysis, plus money-saving tips with our free twice-daily newsletter
Don't miss the latest investment and personal finances news, market analysis, plus money-saving tips with our free twice-daily newsletter
Today, I will show you how my original tramlines in the hourly Dow chart are still operating days later.
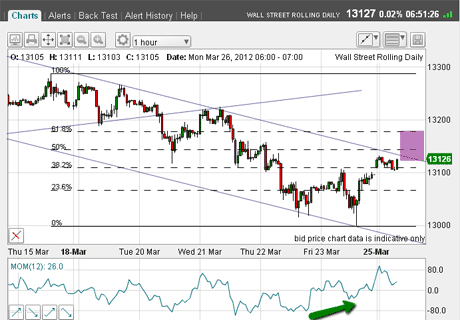
Recall in my last Dow post, I was wondering if the market could break above my upper tramline to make the final fifth wave at a new high. My guess then was that the odds slightly favoured a decline with no new high.
How wrong I was! Here is the chart from 26 March:
(Click on the chart for a larger version)
Let's see how it developed from there:
(Click on the chart for a larger version)
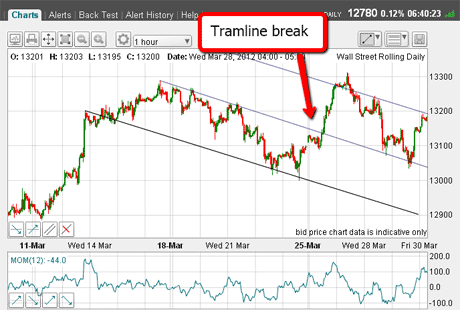
The market did continue the rally, breaking above my upper tramline. But now I could draw in a third upper tramline to give me a clue as to the likely high. Remember, I was expecting a major top since my Elliott wave count off the October low would then be complete with the making of a new rally high in a final fifth wave. This was no time to go long on that tramline break!
The market did turn back in the region of the third tramline and I was able to get a short trade off. Note that the market declined to the upper side of the centre tramline and bounced off this support. This tramline was still working in spades.
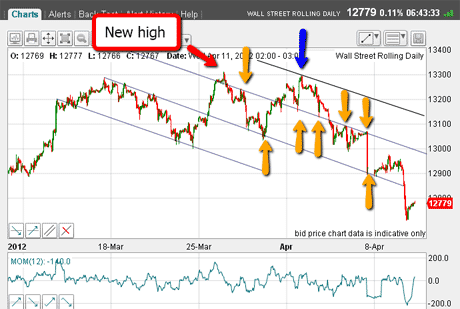
And it proved powerful support as the market made another rally attempt and shot up to my fourth tramline:
(Click on the chart for a larger version)
Trader tip: When a tramline is broken, draw in the next one and use that as a possible target.
The rally took the market up to just shy of the 27 March high (blue arrow) and then began the sharp decline. Note the lovely touch points marked by my yellow arrows, showing that my original tramlines I drew on 26 March are still working.
Making that high was another opportunity to go short.
OK, now we have much more chart development, so can I find another set of tramlines that work?
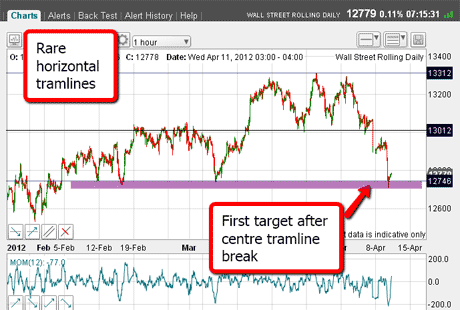
The answer is yes, I can. In a rare example of horizontal tramlines, I can draw my upper one across the three highs and the centre one across the recent lows:
(Click on the chart for a larger version)
And on Good Friday, when most traders were away, the infamous US jobs report was enough of a shock for the market to plunge through the centre tramline. I already had my third lower tramline in place as my target and it was hit overnight in the 12,750 area.
A great opportunity for a contrary trade
So let's recap: We have a completed A-B-C counter-trend rally off the October low and a complete five-wave Elliott wave pattern in wave C at the 13,312 high on 27 March. Momentum has been lagging on the way up, while bullish consensus readings were running almost off the scale. And long-time perma-bears were switching to the long side in droves.
This is a perfect set-up for a major disappointment for the bulls, and the jobs report was enough to trigger the sell-off. In my experience, there have been few situations as clear as this for taking a major contrary stance.
So what is the prognosis? For one thing, there is major chart support at current levels marked by the purple bar. That means I expect a bounce of some sort. If the bounce can gather a little steam, the underside of my centre tramline should contain it. Remember, many traders will still be in buying-on-the-dips' mode, since that has worked well for many months.
Most traders are wrong-footed at major turns
At major turns, most traders will continue with the strategies that have paid off in the recent past. They will deny the significance of recent data and continue to ignore the many elephants on the room that still exist.
Early birds will recognise that the game may well have changed and are willing to test the market with contrary positions. They know that when selling waves get started, they can snowball into an avalanche because traders/investors are fully invested and are totally on board the bull story. This is a set-up for panic selling.
But longer-term, the trend appears to be down now. If so, what is my lower target? Here is my Elliott wave labeling pencilled in:
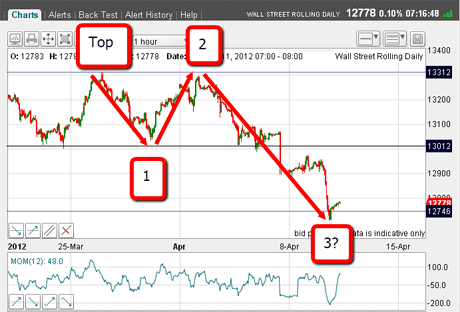
(Click on the chart for a larger version)
I have put in my waves 1 and 2. Wave 2 lies just below wave 1, which obeys the Elliott wave rules. We may have wave 3 at current levels, since the low momentum reading qualifies it as long and strong'. Of course, we could see further weakness very soon as third waves often extend beyond where we consider reasonable!
But if current support holds, the upcoming rally would put in wave 4 where new short positions could be taken and then a new low in wave 5. Following the fifth wave, a larger rally hopefully in an A-B-C form would ensue.
Whatever occurs from here, the percentage play in the Dow is to be short. I have lowered my protective stop to break even, but do not anticipate it being hit. That is my insurance!
If you're a new reader, or need a reminder about some of the methods I refer to in my trades, then do have a look at my introductory videos:
The essentials of tramline trading
An introduction to Elliott wave theory
Advanced trading with Elliott waves
Don't miss my next trading insight. To receive all my spread betting blog posts by email, as soon as I've written them, just sign up here .
Get the latest financial news, insights and expert analysis from our award-winning MoneyWeek team, to help you understand what really matters when it comes to your finances.
John is is a British-born lapsed PhD physicist, who previously worked for Nasa on the Mars exploration team. He is a former commodity trading advisor with the US Commodities Futures Trading Commission, and worked in a boutique futures house in California in the 1980s.
He was a partner in one of the first futures newsletter advisory services, based in Washington DC, specialising in pork bellies and currencies. John is primarily a chart-reading trader, having cut his trading teeth in the days before PCs.
As well as his work in the financial world, he has launched, run and sold several 'real' businesses producing 'real' products.
-
 Should you buy an active ETF?
ETFs are often mischaracterised as passive products, but they can be a convenient way to add active management to your portfolio
-
 Power up your pension before 5 April – easy ways to save before the tax year end
With the end of the tax year looming, pension savers currently have a window to review and maximise what’s going into their retirement funds – we look at how