The Dow blasts through my 12,400 target
Despite the most thorough of analysis, it's easy to be on the wrong side of a losing trade. John C Burford looks at a recent trade in the Dow Jones, and explains how tight money management is vital to stop your losses spiralling out of control.
Get the latest financial news, insights and expert analysis from our award-winning MoneyWeek team, to help you understand what really matters when it comes to your finances.
You are now subscribed
Your newsletter sign-up was successful
Want to add more newsletters?

Twice daily
MoneyWeek
Get the latest financial news, insights and expert analysis from our award-winning MoneyWeek team, to help you understand what really matters when it comes to your finances.

Four times a week
Look After My Bills
Sign up to our free money-saving newsletter, filled with the latest news and expert advice to help you find the best tips and deals for managing your bills. Start saving today!
In my last email on the Dow, I laid out a strong case that my 12,400 target would offer stiff resistance to further advances: The Dow Jones has hit a crossroads at 12,400.
The rally off the 11,900 late June lows had been sharp, there is no doubt. My case centred around the meeting of three tramlines and a co-incident Fibonacci retrace level at the 12,400 area.
As Mr Burns observed, "The best laid plans of mice and men"
MoneyWeek
Subscribe to MoneyWeek today and get your first six magazine issues absolutely FREE

Sign up to Money Morning
Don't miss the latest investment and personal finances news, market analysis, plus money-saving tips with our free twice-daily newsletter
Don't miss the latest investment and personal finances news, market analysis, plus money-saving tips with our free twice-daily newsletter
On 1 July, the market barely hesitated and took off to challenge the 31 May high at 12,600, where the market is currently trading.
And this set-up was one of the best I had researched in a while! I had high confidence that it would work.
But the fact that it went wrong is ample reason why I employ a stop-loss policy, just in case. My 3% rule has kept me out of trouble again.
When trading, we must work with incomplete information, and use our judgment to assess the likelihood of success.
But using time-tested methods gives you an edge over those traders who randomly jump in when the feeling strikes.
Back to the drawing board
OK, so where are we now?
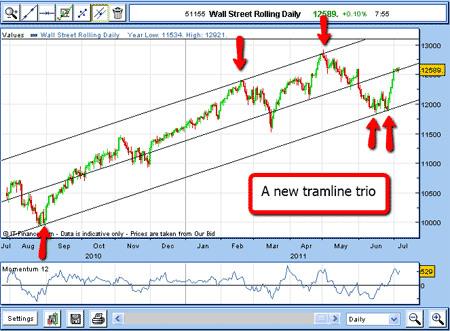
I'll go back to the drawing board and see if I can re-draw the tramlines. Here is the daily chart going back a year:

If I draw my lowest tramline across the important lows of June and last August, I can draw a parallel tramline across the tops of February and May.
All trading over the past year has been contained between these tramlines.
Now, I draw a line mid-way between them that is my central tramline. And although it doesn't pass through many highs and lows except for the recent April low I can use the central tramline as a good working model.
And guess what? The market is pushing up against my central tramline as I write.
Will this line be the immovable object? Hmmm.
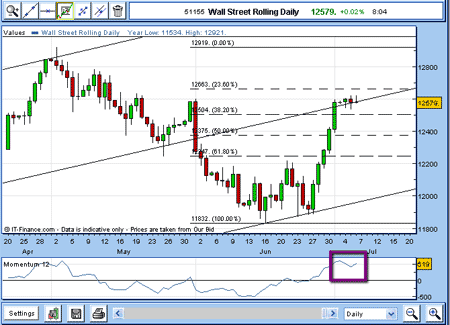
Here is a closer look:

(Click on the chart for a larger version)
The market is resting on my central tramline, but is between the two Fibonacci levels.
I have applied my Fibonacci tool on my spread betting platform using the 2 May high and 16 June low as anchor points. This is the last recent large wave.
Note the high momentum reading following the 700 pip rally in a week, which is what you would expect, of course.
The speed of the rally is really breath-taking, is it not?
We're likely to see a pull-back
Here, I would expect a pull-back at least, and a possibility of another push to the next Fibonacci level at around 12,660.
If it does make it there, there almost certainly won't be much gas left in the tank.
But recall that although the major Fibonacci retracements are given in our spread betting platforms, there is one other level that is missing the one third/two thirds retracement.
I am always on the lookout when these levels are reached, as we have here.
As it happens, the two thirds (2/3, or 66.7%) retracement lies at 12,560. This is right at the current market and right on my centre tramline!
This is getting interesting.
Many readers may be asking "Why is he looking to short the rallies? Surely, the market is rallying and is heading higher. I read bullish articles that forecast higher company earnings in 2012, and they say the market is cheap".
Great question. The answer is, of course, that I have a long-term outlook, which is based on Elliott waves and a reading of the economic mood/sentiment of consumers (who represent 70% of our economy).
My outlook is bearish, and will not change unless the old 2007 high at 14,200 is taken out.
Either way, there will be large swings up and down that can be exploited.
But with Europe on a knife-edge, ballooning US debt, and rampant inflation in China, I believe there is little chance that the 14,200 level will be challenged for some time.
Don't miss my next trading insight. To receive all my spread betting blog posts by email, as soon as I've written them, just sign up here .
Get the latest financial news, insights and expert analysis from our award-winning MoneyWeek team, to help you understand what really matters when it comes to your finances.
John is is a British-born lapsed PhD physicist, who previously worked for Nasa on the Mars exploration team. He is a former commodity trading advisor with the US Commodities Futures Trading Commission, and worked in a boutique futures house in California in the 1980s.
He was a partner in one of the first futures newsletter advisory services, based in Washington DC, specialising in pork bellies and currencies. John is primarily a chart-reading trader, having cut his trading teeth in the days before PCs.
As well as his work in the financial world, he has launched, run and sold several 'real' businesses producing 'real' products.
-
 Should you buy an active ETF?
ETFs are often mischaracterised as passive products, but they can be a convenient way to add active management to your portfolio
-
 Power up your pension before 5 April – easy ways to save before the tax year end
With the end of the tax year looming, pension savers currently have a window to review and maximise what’s going into their retirement funds – we look at how