The Dax is incredibly volatile at the moment
Germany's turbulent benchmark index is providing rich pickings for chart-following swing traders. John C Burford explains.
Get the latest financial news, insights and expert analysis from our award-winning MoneyWeek team, to help you understand what really matters when it comes to your finances.
You are now subscribed
Your newsletter sign-up was successful
Want to add more newsletters?

Twice daily
MoneyWeek
Get the latest financial news, insights and expert analysis from our award-winning MoneyWeek team, to help you understand what really matters when it comes to your finances.

Four times a week
Look After My Bills
Sign up to our free money-saving newsletter, filled with the latest news and expert advice to help you find the best tips and deals for managing your bills. Start saving today!
At the MoneyWeek Conference on Friday, I gave a talk entitled: "How I trade today's volatile markets".
Many markets are indeed in highly volatile phases today and that is, in large part, the result of the massive battle being waged between the forces of inflation and deflation.
Since the inception of central bank monetary stimulus in 2008, asset prices have been inflated to gigantic proportions. But recently, we've seen signs that consumer and commodity prices around the world are actually falling into negative growth a sure sign of a deflationary cause.
MoneyWeek
Subscribe to MoneyWeek today and get your first six magazine issues absolutely FREE

Sign up to Money Morning
Don't miss the latest investment and personal finances news, market analysis, plus money-saving tips with our free twice-daily newsletter
Don't miss the latest investment and personal finances news, market analysis, plus money-saving tips with our free twice-daily newsletter
Another deflationary input is the soaring US dollar, which puts pressure on domestic raw materials prices, making manufactured goods cheaper. The crude oil price decline is a case in point.
This is producing a huge tug-of-war in the stock markets and is one reason the FTSE, for example, has gone nowhere in two years.
This morning, I will follow up Wednesday's coverage of the Dax. That market is giving traders some terrific opportunities to put my simple tramline trading rules into practice and locate excellent swing trades with little or no guesswork.
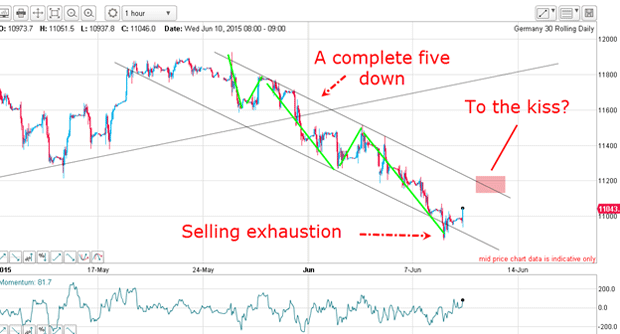
A 400-pip rally made my hard yards worthwhile
all
the
hallmarks
of
a
selling
exhaustion
at
the
end
of
a
sharp
break
My first target was the upper tramline in the pink zone. If the market could overcome that resistance, it would move towards a tramline kiss, making a long trade very tempting.

That plunge and rapid recovery was a sure sign that the decline had very likely run its course, and that the path of least resistance was up. That observation was not based on guesswork, but on real-life evidence the market was offering.
Many traders base their forecasts on guesswork alone, and this often leads to a failed trade. Wait for a clear signal from the market and then draw your conclusions. Put the horse before the cart!
After that selling exhaustion, the natural forecast was for a rally up to my upper tramline, and possibly beyond.
Sure enough, the large momentum divergence at the selling exhaustion low was the fuel that lit the rocket and the market gained 500 pips over the next two days! That was a profit well worth working for.

Saving yourself stress will make you a better trader
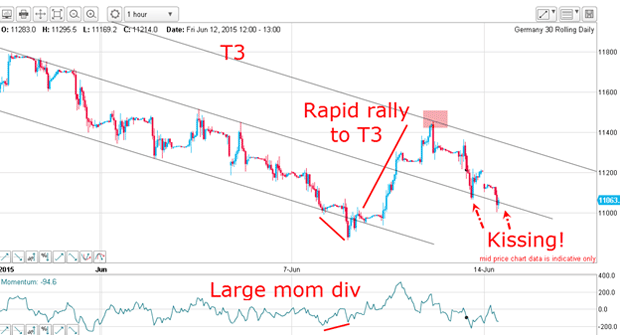
Remember, whenever I see a tramline break, I always draw in T3, which gives me my first target and a clear profit objective.
That way I can make a decision on where to take profits in advance. In fact, I can even enter a limit order on my trading platform deciding where to sell out my position ahead of time. Much better than staring anxiously at a screen!
A long trade taken at the 11,000 level and exited at the 11,400 level would have produced a very acceptable profit of 400 pips in two days, or 4,000 euros for every £1 bet. As they say, that beats the building society!
Of course, whenever T3 is hit, it's possible that the market will come back and test the centre tramline again in a kiss. And that is precisely what is happening as I write:

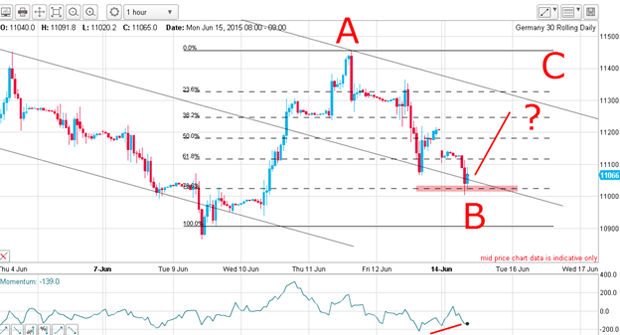
The market has planted another kiss and has made a Fibonacci 78% retrace off last week's rally. There is a potential positive-momentum divergence building, and that could support another rally leg back towards T3 a repeat of last week's exhaustion rally.
If this occurs, that sets up my Elliott wave labels as a distinct possibility. A rally here would set the market to test T3 again and a break would verify the wave C label.
And that would set the market on towards the larger kiss I suggested in Wednesday's post.
Get the latest financial news, insights and expert analysis from our award-winning MoneyWeek team, to help you understand what really matters when it comes to your finances.
John is is a British-born lapsed PhD physicist, who previously worked for Nasa on the Mars exploration team. He is a former commodity trading advisor with the US Commodities Futures Trading Commission, and worked in a boutique futures house in California in the 1980s.
He was a partner in one of the first futures newsletter advisory services, based in Washington DC, specialising in pork bellies and currencies. John is primarily a chart-reading trader, having cut his trading teeth in the days before PCs.
As well as his work in the financial world, he has launched, run and sold several 'real' businesses producing 'real' products.
-
 Average UK house price reaches £300,000 for first time, Halifax says
While the average house price has topped £300k, regional disparities still remain, Halifax finds.
-
 Barings Emerging Europe trust bounces back from Russia woes
Barings Emerging Europe trust has added the Middle East and Africa to its mandate, delivering a strong recovery, says Max King