How I’m trading Germany's Dax index
Until recently, buying German shares has been a no-brainer, says John C Burford. But is the bull market still intact?
Get the latest financial news, insights and expert analysis from our award-winning MoneyWeek team, to help you understand what really matters when it comes to your finances.
You are now subscribed
Your newsletter sign-up was successful
Want to add more newsletters?

Twice daily
MoneyWeek
Get the latest financial news, insights and expert analysis from our award-winning MoneyWeek team, to help you understand what really matters when it comes to your finances.

Four times a week
Look After My Bills
Sign up to our free money-saving newsletter, filled with the latest news and expert advice to help you find the best tips and deals for managing your bills. Start saving today!
The German stock index - the Dax is proving to be a popular market to trade with new students of the Trade for Profit Academy. Today, I will show how I am trading it.
Until recently, European stocks were the talk of the town, mainly because they were considered cheap compared with many other global markets. And the kicker was the falling euro, which naturally was seen to benefit German stocks in particular, because of their huge export presence.
That made buying German stocks a no-brainer until recently.
MoneyWeek
Subscribe to MoneyWeek today and get your first six magazine issues absolutely FREE

Sign up to Money Morning
Don't miss the latest investment and personal finances news, market analysis, plus money-saving tips with our free twice-daily newsletter
Don't miss the latest investment and personal finances news, market analysis, plus money-saving tips with our free twice-daily newsletter
The problem with that line of thinking is that it assumes that stocks will always be rising. Remember, in a falling market, cheap stocks get even cheaper. So buying on the basis of relative value' only works in bull markets and fails miserably in bear trends.
So the big question today is this: is the bull market intact or not?
The Dax is heading down but probably not for long

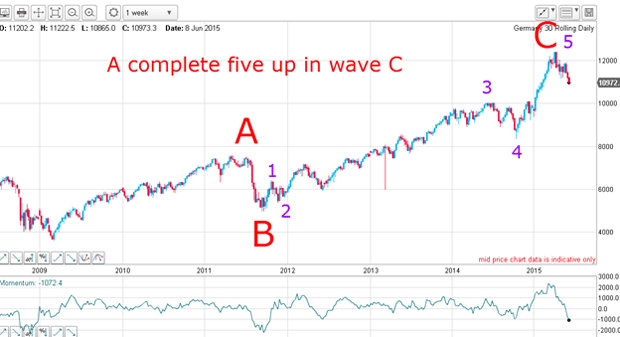
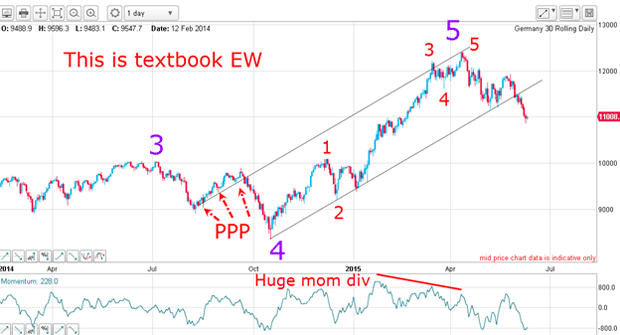
What's more, the C wave contains its own classic five up which has also completed at the wave 5 high in April. And this mini-five up has a lovely long and strong wave 3 and a textbook A-B-C form to wave 4.
But the icing on the cake is the form of wave 5. I have a lovely tramline pair where the upper tramline has multiple prior pivot points (PPPs) and takes in the recent highs. The lower tramline sports five accurate touch points, making this line highly reliable as a line of resistance now that the break occurred on 1 June.

But note the five up pattern in the purple wave 5, complete with a huge momentum divergence at the top. That was the final signal to start looking for an exit (if long) and/or sell short.
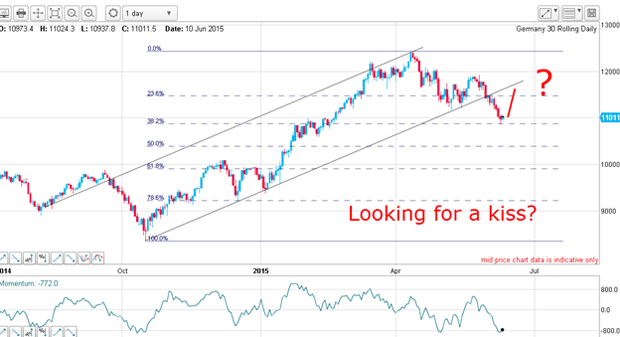
The odds are very high that the main trend is now down. But what are the prospects today? With the sharp breaks, momentum is very oversold and a relief rally appears likely.

The market has hit the Fibonacci 38% support level, which makes a near-term rally highly likely. That sets up the possibility the market could make a kiss on the lower tramline before peeling down in a scalded cat bounce.
If that occurs, a textbook trade entry will be presented.
A rally could be coming but how strong might it be?

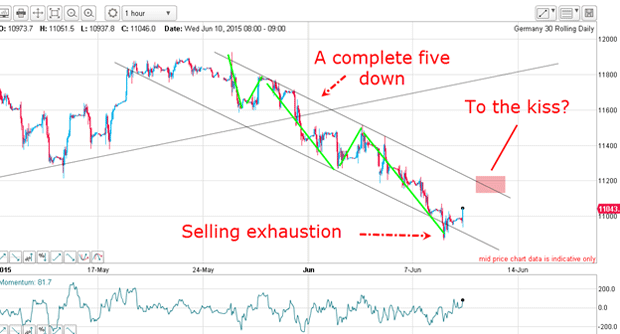
However, yesterday's plunge low below my lower tramline has all the hallmarks of a selling exhaustion, which often comes at the end of a sharp break, such as we have seen here.
My first target is the upper tramline in the pink zone. If the market can overcome that resistance, it will be onward towards that kiss, making a long trade very tempting.
Get the latest financial news, insights and expert analysis from our award-winning MoneyWeek team, to help you understand what really matters when it comes to your finances.
John is is a British-born lapsed PhD physicist, who previously worked for Nasa on the Mars exploration team. He is a former commodity trading advisor with the US Commodities Futures Trading Commission, and worked in a boutique futures house in California in the 1980s.
He was a partner in one of the first futures newsletter advisory services, based in Washington DC, specialising in pork bellies and currencies. John is primarily a chart-reading trader, having cut his trading teeth in the days before PCs.
As well as his work in the financial world, he has launched, run and sold several 'real' businesses producing 'real' products.
-
 ISA fund and trust picks for every type of investor – which could work for you?
Whether you’re an ISA investor seeking reliable returns, looking to add a bit more risk to your portfolio or are new to investing, MoneyWeek asked the experts for funds and investment trusts you could consider in 2026
-
 The most popular fund sectors of 2025 as investor outflows continue
It was another difficult year for fund inflows but there are signs that investors are returning to the financial markets