The charts have spoken: gold is going to take off
John C Burford explains why the charts point to a higher gold price, and why you should always set your stop-losses just in case.
Get the latest financial news, insights and expert analysis from our award-winning MoneyWeek team, to help you understand what really matters when it comes to your finances.
You are now subscribed
Your newsletter sign-up was successful
Want to add more newsletters?

Twice daily
MoneyWeek
Get the latest financial news, insights and expert analysis from our award-winning MoneyWeek team, to help you understand what really matters when it comes to your finances.

Four times a week
Look After My Bills
Sign up to our free money-saving newsletter, filled with the latest news and expert advice to help you find the best tips and deals for managing your bills. Start saving today!
When I signed off on Wednesday, I noted that gold was in a very interesting position.
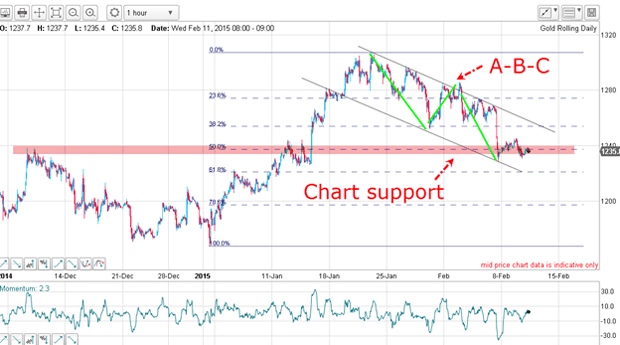
Gold had been trending downwards for about two weeks. But from my reading of the chart, it looked like it was about to turn back up.
On Wednesday I said "It's looking more and more likely that the market is about to stage a bounce."
MoneyWeek
Subscribe to MoneyWeek today and get your first six magazine issues absolutely FREE

Sign up to Money Morning
Don't miss the latest investment and personal finances news, market analysis, plus money-saving tips with our free twice-daily newsletter
Don't miss the latest investment and personal finances news, market analysis, plus money-saving tips with our free twice-daily newsletter
I used the word "likely", because there is never a 100% guarantee that the market will do what you think. It may, in fact, plunge right through the levels you expect it to. This can and does happen. That is why it is essential to use protective stop-loss orders at all times.
But when you have multiple levels of support (ie, factors which indicate that the price will rise higher) all meeting more or less together, then you definitely have the odds on your side. And that is all we can ever ask for.
So today, I will continue the gold story, because it is demonstrating in real time how powerful is the combination of Elliott wave counts, tramlines and Fibonacci levels to give you high-confidence/low-risk trades.
These three are the pillars of my tramline trading method.
And if you wish to use my method, then it will pay you to be proficient in these skills.
Two things are 'supporting' the gold price

The market had declined to the Fibonacci 50% retrace of the move up from the early January low (I've highlighted this in a pink bar), and had hit the lower tramline. This suggested to me that the low was near, and that a rally was in the offing.
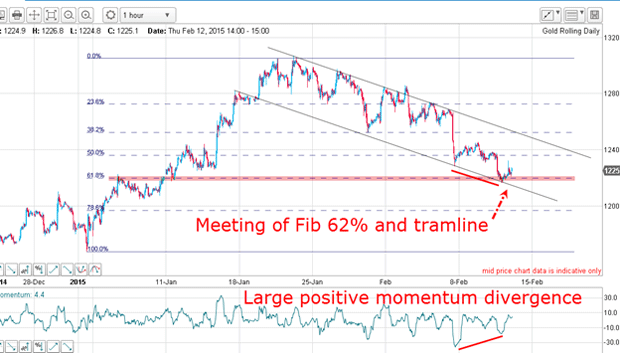
So here's what the chart looked like yesterday:

As you can see, the market hit the lower tramline right at the level of the 62% Fibonacci retracement.
How I traded this
If I'm right, and I have found a low at the $1,220 level, how does that inform my Elliott wave count?
On Wednesday, I suggested that the first A-B-C off the November low may be the first stage in a larger rally (remember, A-B-C are Elliott wave patterns which form just after the market has made a turn).
The alternative scenario was for my original A-B-C to lead to a move down off the C wave $1,300 high towards the November low.
This was the Elliott wave chart I posted on Wednesday:

So the arrival at the $1,220 level is the moment of truth. Will gold continue its decline?
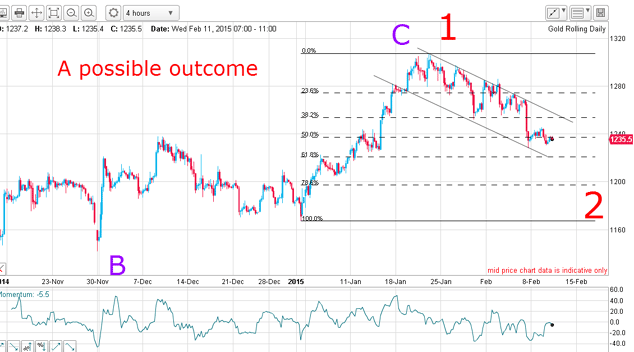
If the $1,220 level holds, it strengthens my case that gold is about to rise in value. If that were to happen, this is what the Elliott wave count might look like:

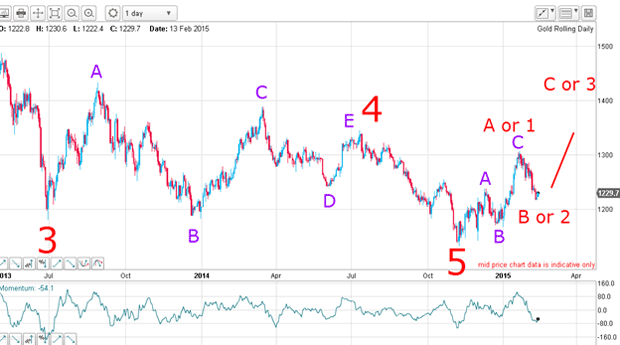
The $1,220 level could be showing one of two different Elliott wave patterns. It either could be the the B wave of the A-B-C pattern (shown on the chart, in red, as B); or a wave 2 of a one to five pattern. It is too early to say which.
Either way both scenarios imply a move up from here.
Gold will rally. And this will occur in the face of peace breaking out in Ukraine, rising stock markets, and falling interest rates all factors than normally are bearish for gold.
I rest my case (and I have a stop loss, just in case).
Get the latest financial news, insights and expert analysis from our award-winning MoneyWeek team, to help you understand what really matters when it comes to your finances.
John is is a British-born lapsed PhD physicist, who previously worked for Nasa on the Mars exploration team. He is a former commodity trading advisor with the US Commodities Futures Trading Commission, and worked in a boutique futures house in California in the 1980s.
He was a partner in one of the first futures newsletter advisory services, based in Washington DC, specialising in pork bellies and currencies. John is primarily a chart-reading trader, having cut his trading teeth in the days before PCs.
As well as his work in the financial world, he has launched, run and sold several 'real' businesses producing 'real' products.
-
 ISA fund and trust picks for every type of investor – which could work for you?
Whether you’re an ISA investor seeking reliable returns, looking to add a bit more risk to your portfolio or are new to investing, MoneyWeek asked the experts for funds and investment trusts you could consider in 2026
-
 The most popular fund sectors of 2025 as investor outflows continue
It was another difficult year for fund inflows but there are signs that investors are returning to the financial markets