Gold’s going down, but not for long
Gold bugs have been disappointed again, says John C Burford. But they could be smiling again soon.
Get the latest financial news, insights and expert analysis from our award-winning MoneyWeek team, to help you understand what really matters when it comes to your finances.
You are now subscribed
Your newsletter sign-up was successful
Want to add more newsletters?

Twice daily
MoneyWeek
Get the latest financial news, insights and expert analysis from our award-winning MoneyWeek team, to help you understand what really matters when it comes to your finances.

Four times a week
Look After My Bills
Sign up to our free money-saving newsletter, filled with the latest news and expert advice to help you find the best tips and deals for managing your bills. Start saving today!
Gold bugs have been disappointed once again.
Gold reached the giddy heights of $1,300 on January 22 (up from the $1,130 low last November) before crumbling, along with many related stocks.
You could see it coming when articles popped up proclaiming gold was back on track to make it to $3,000. The tone was certainly more bullish until recently.
MoneyWeek
Subscribe to MoneyWeek today and get your first six magazine issues absolutely FREE

Sign up to Money Morning
Don't miss the latest investment and personal finances news, market analysis, plus money-saving tips with our free twice-daily newsletter
Don't miss the latest investment and personal finances news, market analysis, plus money-saving tips with our free twice-daily newsletter
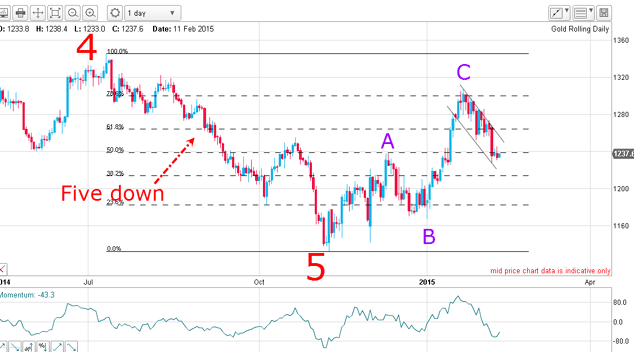
What's coming next? Let's look at the wave on the daily chart.

This is always a corrective pattern, and indicates that the next move will be down.
The rally to $1,300 also hit the Fibonacci 78% level of wave 5 and was one of the factors that made me quit and take my profits.
Does all this mean new lows are now certain? After all, the A-B-C is a clear signal, is it not, that the downtrend has resumed?
Not quite!
Normally, that would be a correct conclusion, but the A-B-C rally to date appears too small compared to the record bearishness at the November low. Also, the A-B-C rally has only lasted three months, which is much shorter than the other major waves.
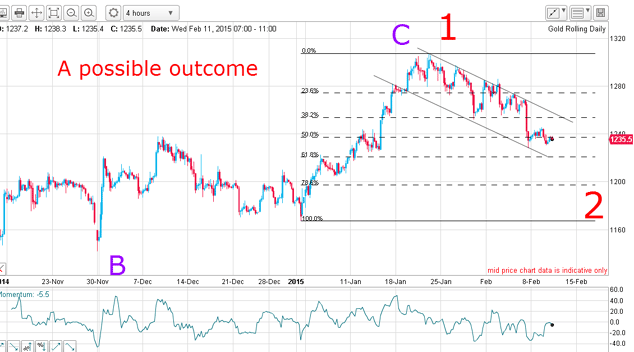
I think the odds are good that we could see a resumption of the rally above $1,300.
How will that work out? Here is a possible outcome:

Either scenario implies the market could find a bottom and then rally above $1,300 in either a large wave 3 or large C wave.
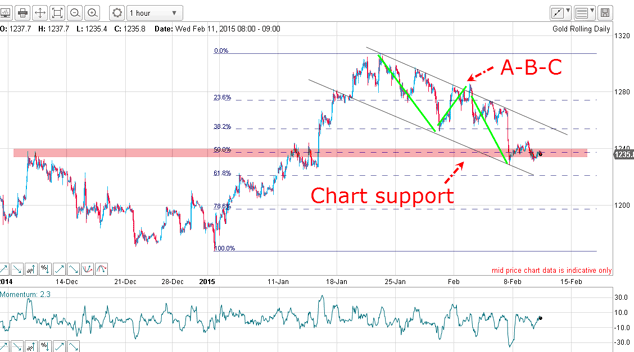
That's one possibility. Let's zoom in on the smaller scale one-hour chart:

The market hasn't broken my lower tramline so far.
In addition, the market is at the important Fibonacci 50% level.
That level's important because there are accurate bounces off the 23% and 38% levels on the way down. When you see that, you can rely on the lower 50% and 62% levels as providing support.
It's looking more and more likely that the market is about to stage a bounce If that happens, the upper tramline comes into play as the next line of resistance.
Of course, breaking up through it would indicate the rally was back on and a rise towards the $1300 level would then become much more probable.
Will gold bugs be smiling again soon? We'll see.
Get the latest financial news, insights and expert analysis from our award-winning MoneyWeek team, to help you understand what really matters when it comes to your finances.
John is is a British-born lapsed PhD physicist, who previously worked for Nasa on the Mars exploration team. He is a former commodity trading advisor with the US Commodities Futures Trading Commission, and worked in a boutique futures house in California in the 1980s.
He was a partner in one of the first futures newsletter advisory services, based in Washington DC, specialising in pork bellies and currencies. John is primarily a chart-reading trader, having cut his trading teeth in the days before PCs.
As well as his work in the financial world, he has launched, run and sold several 'real' businesses producing 'real' products.
-
 Average UK house price reaches £300,000 for first time, Halifax says
While the average house price has topped £300k, regional disparities still remain, Halifax finds.
-
 Barings Emerging Europe trust bounces back from Russia woes
Barings Emerging Europe trust has added the Middle East and Africa to its mandate, delivering a strong recovery, says Max King