The battle of the tramlines
With gold throwing up a whole series of highs and lows, John C Burford draws in several tramlines to contain the market action. So, which way now for gold?
Get the latest financial news, insights and expert analysis from our award-winning MoneyWeek team, to help you understand what really matters when it comes to your finances.
You are now subscribed
Your newsletter sign-up was successful
Want to add more newsletters?

Twice daily
MoneyWeek
Get the latest financial news, insights and expert analysis from our award-winning MoneyWeek team, to help you understand what really matters when it comes to your finances.

Four times a week
Look After My Bills
Sign up to our free money-saving newsletter, filled with the latest news and expert advice to help you find the best tips and deals for managing your bills. Start saving today!
In recentposts on gold, I have shown how you can use the Fibonacci retrace levels combined with tramlines to plan many excellent trades. And since my last gold post on 6 February, there have been even more offerings!
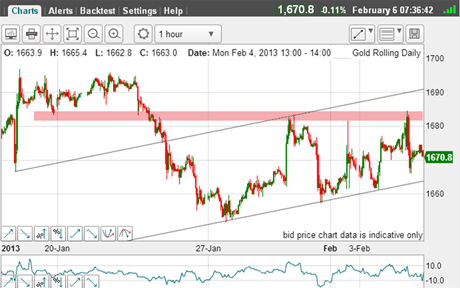
Recall the hourly chart (below)from 6 February showing excellent tramlines.
I based the latest long entry at the $1,660 area as it came down to the lower tramline.
MoneyWeek
Subscribe to MoneyWeek today and get your first six magazine issues absolutely FREE

Sign up to Money Morning
Don't miss the latest investment and personal finances news, market analysis, plus money-saving tips with our free twice-daily newsletter
Don't miss the latest investment and personal finances news, market analysis, plus money-saving tips with our free twice-daily newsletter
A move back up the resistance zone (pink bar) was an opportunity to take profit.
The upper tramline was missed, which is an early indication that the market was not strong enough to sustain the rally for much longer. This was likely to bea relief rally in an ongoing bear move.
(Click on the chart for a larger version)
A decisive break of the lower tramline would confirm this view.
Naturally, if I were still holding my long trade, I would be placing a protective stop at break-even.
Spiked out
So let's see how the market developed:
(Click on the chart for a larger version)
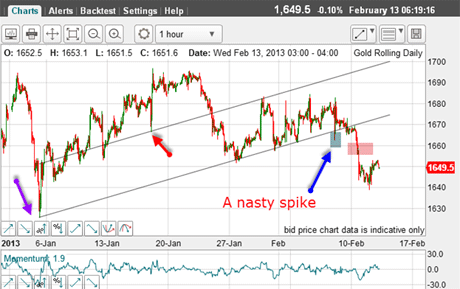
Note that my lower tramline parallel to the upper one, of course passes right through the major low of the 4 January (purple arrow). This confirms I have a reliable pair of lines.
As I suspected, the rally did not last. On 7 February the market broke the lower tramline in a nasty spike and promptly recovered to move inside the trading channel.
As I never tire of saying, the gold market is full of spikes that can catch you out, so this event was not unexpected.
If you had placed a short order just underneath the tramline you would have been whipsawed. But don't think they' are against you every trader gets spiked occasionally.
The only advice I can offer is to keep watching for weakness, as this spike is a signal that the market probably wants to move lower.
A more secure entry point is the area of the pink bar, but you would be giving up a lot of potential profit.
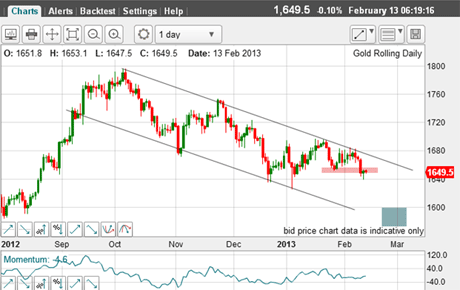
Let's go back to the daily chart for perspective:
(Click on the chart for a larger version)
I can now re-draw my tramlines slightly to include the recent highs on the upper tramline.
This week saw a break of the minor low (pink bar), and this indicates the market's next directionis probablydown.
If the tramlines are still operating, the next target is on or near the lower tramline in the region of the blue bar under $1,600.
Battle of the tramlines
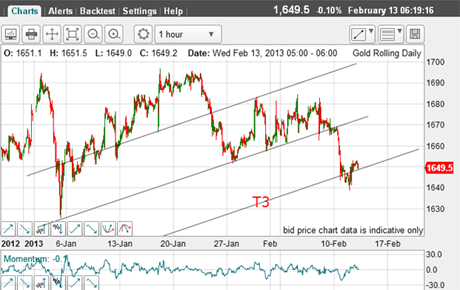
Let's now go back to the hourly chart for clues as to the near-term direction:
(Click on the chart for a larger version)
Right on cue, the decline stopped at the third tramline with an overshoot.
Having hit a tramline, this is the moment of truth.
A resumption of the decline would propel the market towards my target, while a relief rally here would run into considerable overhead resistance.
So the odds favour a test at least of yesterday's $1,640 lows.
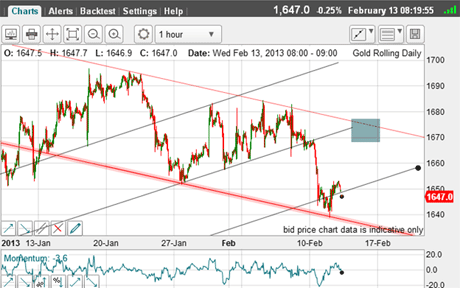
Now I have a series of lower highs, can I draw in a down-sloping tramline pair?
(Click on the chart for a larger version)
I certainly can! I do like the lower line, as it catches both major lows.
Now, this throws up an interesting question. If the new (red) tramlines take precedence, the target is near the upper red line in the blue zone (or slightly to the right) around $1,670.
So, this is a battle of the tramlines!
The near-term trend is down and so this has the edge, so far.
But with trader sentiment having taken a big knock in recent weeks professionals' bullish sentiment dropped to 10% I am notruling the rally scenario out.
All of this means I am on the sidelines, watching for another trading opportunity.
If you're a new reader, or need a reminder about some of the methods I refer to in my trades, then do have a look at my introductory videos:
The essentials of tramline trading
An introduction to Elliott wave theory
Advanced trading with Elliott waves
Don't miss my next trading insight. To receive all my spread betting blog posts by email, as soon as I've written them, just sign up here . If you have any queries regarding MoneyWeek Trader, please contact us here.
Get the latest financial news, insights and expert analysis from our award-winning MoneyWeek team, to help you understand what really matters when it comes to your finances.
John is is a British-born lapsed PhD physicist, who previously worked for Nasa on the Mars exploration team. He is a former commodity trading advisor with the US Commodities Futures Trading Commission, and worked in a boutique futures house in California in the 1980s.
He was a partner in one of the first futures newsletter advisory services, based in Washington DC, specialising in pork bellies and currencies. John is primarily a chart-reading trader, having cut his trading teeth in the days before PCs.
As well as his work in the financial world, he has launched, run and sold several 'real' businesses producing 'real' products.
-
 MoneyWeek Talks: The funds to choose in 2026
Podcast Fidelity's Tom Stevenson reveals his top three funds for 2026 for your ISA or self-invested personal pension
-
 Three companies with deep economic moats to buy now
Opinion An economic moat can underpin a company's future returns. Here, Imran Sattar, portfolio manager at Edinburgh Investment Trust, selects three stocks to buy now