More Fibonacci trades in gold
When faced with choppy markets such as gold, the Fibonacci method comes into its own, says John C Buford. Here, he applies this charting tool to see where gold is heading next.
Get the latest financial news, insights and expert analysis from our award-winning MoneyWeek team, to help you understand what really matters when it comes to your finances.
You are now subscribed
Your newsletter sign-up was successful
Want to add more newsletters?

Twice daily
MoneyWeek
Get the latest financial news, insights and expert analysis from our award-winning MoneyWeek team, to help you understand what really matters when it comes to your finances.

Four times a week
Look After My Bills
Sign up to our free money-saving newsletter, filled with the latest news and expert advice to help you find the best tips and deals for managing your bills. Start saving today!
I find the gold market one of the trickiest to swing trade but that does not stop me trying! This market is particularly prone to spiky moves, where there is a sharp move either up or down, and then a rapid retracement. It is as if some traders are gunning for the stops and I'm sure some do.
When I started trading the Comex was notorious for this practice, since trading there was open outcry only.
In fact, many traders automatically fade these moves (they buy when the sell-stops are hit), and many make a decent living at it, I'm sure.
MoneyWeek
Subscribe to MoneyWeek today and get your first six magazine issues absolutely FREE

Sign up to Money Morning
Don't miss the latest investment and personal finances news, market analysis, plus money-saving tips with our free twice-daily newsletter
Don't miss the latest investment and personal finances news, market analysis, plus money-saving tips with our free twice-daily newsletter
Many traders use previous minor highs and lows to position their stops. If long, they would place their stop just under a recent low. How many times have we seen the market take these out, and then resume the advance?
This stop-loss strategy is poor. I prefer to use either tramlines or adjacent Fibonacci levels as my guide.
In recent posts, I have shown that it is possible to use Fibonacci retracements to guide both low-risk entries and exits. In fact, there have been several trading opportunities available.
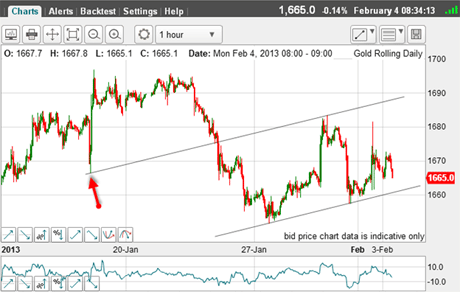
In Monday's post, I noted that the market sported a near-perfect tramline pair on the hourly chart:
(Click on the chart for a larger version)
Then, the market was heading for my lower tramline, and according to my tramline trading rule, I was waiting for a closer encounter in order to enter a low-risk long trade.
Of course, with secure tramlines drawn, I could enter a resting buy order ahead and take a chance that the market would touch it... and get on with my life!
This is the ideal option for a busy trader who is not able to constantly monitor their screen. That is just one of the many benefits of trading with tramlines.
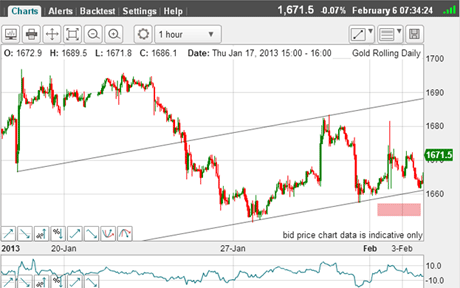
As it happened, the market did make a close encounter, and I was in with a long trade:
(Click on the chart for a larger version)
I placed my protective stop just under the tramline (pink bar) for a low-risk trade.
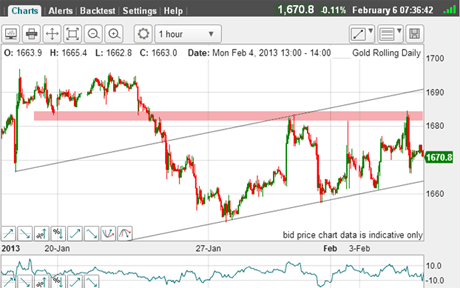
The market duly found support there and moved back up:
(Click on the chart for a larger version)
When the market rallied to the $1,680 area, it hit resistance (pink bar). This was a possible level to take profits, of course.
There's always another bus
This is a moment of decision for all traders! Will you take a quick profit there and possibly miss out on more gain if the resistance can be broken or stay with the trade with your protective stop moved to break-even?
Whatever decision is made and there is no golden rule here you have to live with it. No regrets! Move on to the next trade.
Your goal should be the business-like gradual accumulation of profits over time. In a month, you will have forgotten this trade. It's not important in the great scheme of things.
If you had taken profits and the market was soaring up, there will be another opportunity to get back on board using your trading methods.
And if the market moved back down and stopped you out at break-even, that was a nothing trade. No big deal. Just keep monitoring the market for signs of another entry, be it long or short. There is always another bus coming along.
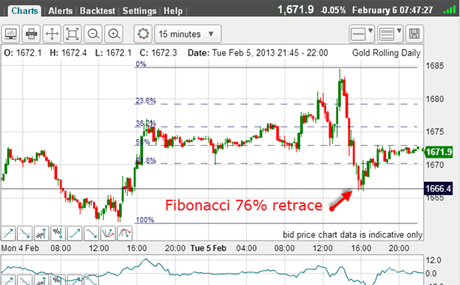
As it happened, the resistance was a brick wall and the market moved down. This is the position this morning:
(Click on the chart for a larger version)
The move down off the $1,684 high was very sharp, but stopped right on the Fibonacci 76% retrace. That is very pretty and gives another trading opportunity.
I am still trading on the long side within my tramlines with the trend still up (lower tramline holding), so the correct trade is to buy at the Fibonacci level with a protective stop just below for another low-risk entry.
But a glance at the above chart will tell youthat the market is rallying into overhead resistance and will likely encounter difficulty in progressing.
So where is the market likely to turn?
Once again, I turn to my trusty Fibonacci tool:
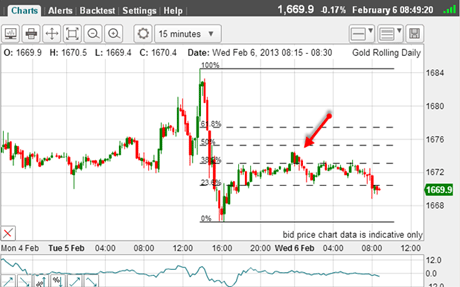
(Click on the chart for a larger version)
There is a slight overshoot of the Fibonacci 38% level, but that was the area to consider taking profits on the long trade.
I have applied my Fibonacci tool to the latest pivot points, as I always recommend.
So, again, Mr Fibonacci proves himself very useful indeed. I must visit Pisa and pay homage to this generous man!
If you're a new reader, or need a reminder about some of the methods I refer to in my trades, then do have a look at my introductory videos:
The essentials of tramline trading
An introduction to Elliott wave theory
Advanced trading with Elliott waves
Don't miss my next trading insight. To receive all my spread betting blog posts by email, as soon as I've written them, just sign up here . If you have any queries regarding MoneyWeek Trader, please contact us here.
Get the latest financial news, insights and expert analysis from our award-winning MoneyWeek team, to help you understand what really matters when it comes to your finances.
John is is a British-born lapsed PhD physicist, who previously worked for Nasa on the Mars exploration team. He is a former commodity trading advisor with the US Commodities Futures Trading Commission, and worked in a boutique futures house in California in the 1980s.
He was a partner in one of the first futures newsletter advisory services, based in Washington DC, specialising in pork bellies and currencies. John is primarily a chart-reading trader, having cut his trading teeth in the days before PCs.
As well as his work in the financial world, he has launched, run and sold several 'real' businesses producing 'real' products.
-
 Can mining stocks deliver golden gains?
With gold and silver prices having outperformed the stock markets last year, mining stocks can be an effective, if volatile, means of gaining exposure
-
 8 ways the ‘sandwich generation’ can protect wealth
People squeezed between caring for ageing parents and adult children or younger grandchildren – known as the ‘sandwich generation’ – are at risk of neglecting their own financial planning. Here’s how to protect yourself and your loved ones’ wealth.