How to decide where to set your tramlines
John C Burford explains how he sets the tramlines on his trading charts, and how he uses them to enter trades and decide where to take profits.
Get the latest financial news, insights and expert analysis from our award-winning MoneyWeek team, to help you understand what really matters when it comes to your finances.
You are now subscribed
Your newsletter sign-up was successful
Want to add more newsletters?

Twice daily
MoneyWeek
Get the latest financial news, insights and expert analysis from our award-winning MoneyWeek team, to help you understand what really matters when it comes to your finances.

Four times a week
Look After My Bills
Sign up to our free money-saving newsletter, filled with the latest news and expert advice to help you find the best tips and deals for managing your bills. Start saving today!
In my recent posts, I have leaned heavily on my tramline trading approach to ferret out promising trades. I have given several examples in most time-frames.
But recently, I have been asked how I know where to set the tramlines, given all the various possibilities.
So I thought I would give a few ideas that I have developed over the years that work for me.
MoneyWeek
Subscribe to MoneyWeek today and get your first six magazine issues absolutely FREE

Sign up to Money Morning
Don't miss the latest investment and personal finances news, market analysis, plus money-saving tips with our free twice-daily newsletter
Don't miss the latest investment and personal finances news, market analysis, plus money-saving tips with our free twice-daily newsletter
Choosing the significant pivot points
Remember that tramlines are simply straight lines on the chart that act as lines of support and resistance.
You can use them for entering low-risk trades. Not every trade will work out, but keeping losses small will ensure that your winners count.
When first presented with a price chart, I scan over it to see where the important highs and lows are. By eye, I can tell whether there are two or more which may lie on a straight line.
When I have found at least two potential pivot points, I draw my tentative tramline, which may stay or be erased, depending on what happens in my search for another tramline.
Then, using the parallel line tool provided on my spread betting platform, I run my mouse over the chart to see if any other significant highs and lows lie on a straight line.
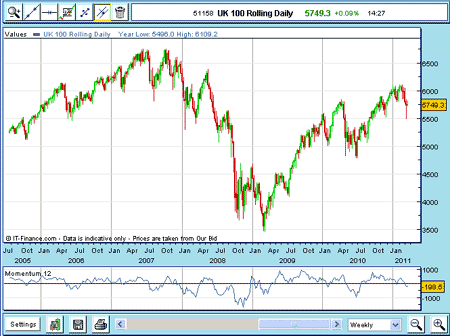
Here is an example the weekly FTSE chart:
(Click on the chart for a larger version)
At first glance, there seems to be nothing there for us.
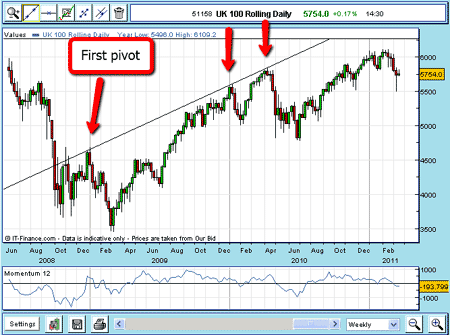
But if I select the significant high made in January 2009 as my first pivot point and draw a line to the next significant high in January 2010, I find the line also passes through the next high set in April 2010!
(Click on the chart for a larger version)
With this terrific confirmation that my line is very significant (after all, it held its line in April as the market bounced off it), I can say that is my base tramline.
Finding a parallel tramline
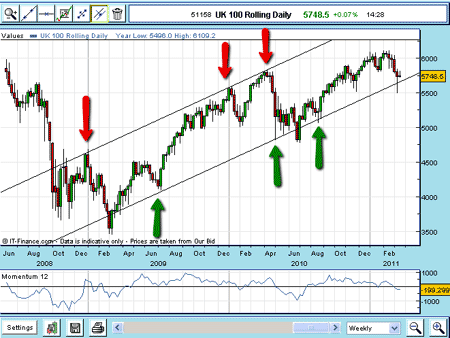
Now I go looking for another tramline parallel to it.
I don't have to go far before I spot one it passes through the July 2009 low (significant), and also through several lows in 2010.
(Click on the chart for a larger version)
One note here this second line has two major "overshoots".
That is not fatal to my case, as they are to be expected during volatile trading, as we saw then.
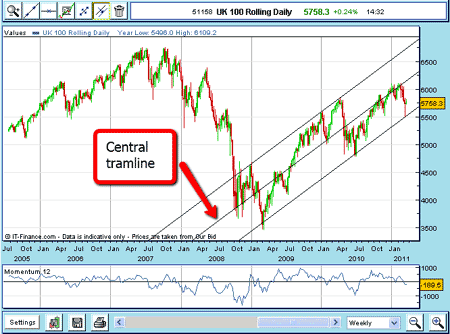
But look at what happens when I draw a central tramline:
(Click on the chart for a larger version)
It also passes through significant highs and lows!
These are important long-term tramlines and give me guidance over shorter-term trading.
But within each chart, there are potentially other sets of tramlines.
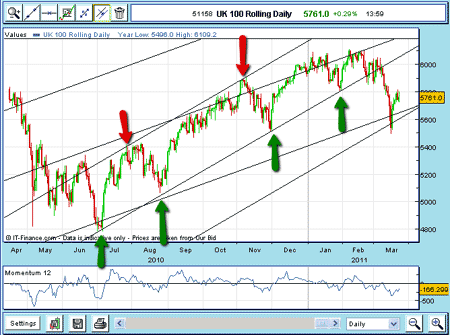
Let's look at the daily chart now:
(Click on the chart for a larger version)
If I take the July low as a pivot point, I can draw a line which passes through other significant points (red arrows).
Using my parallel line tool, I see that an upper tramline passes right through the highs marked by green arrows.
Now I have another important tramline pair, which I can use for trading.
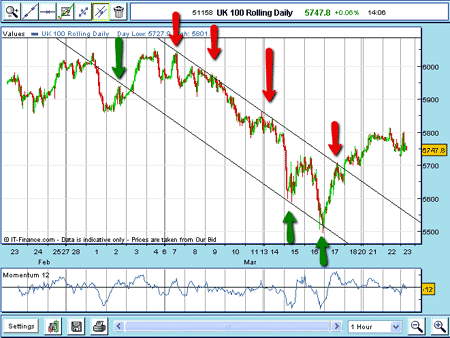
I can go even closer with the hourly chart:
(Click on the chart for a larger version)
Right away, I see that the highs on the way down are in a straight line, so I draw my upper tramline there, marking the highs with red arrows.
With my parallel line tool, I hover over the chart and see that I can draw my lower tramline as marked.
The touch points are marked with green arrows.
For trading, a good trade was to enter buy stops just above the tramline on March 18, anticipating a break-through.
Where to take profits
OK, where to take profits?
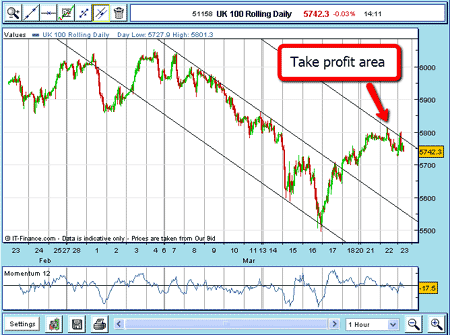
Let's draw a third tramline above the first equidistant from it:
(Click on the chart for a larger version)
The market rallied right up to my third tramline, where profits could be taken for a nice 100 pip profit in two days.
Of course, many potential tramlines do not work out, and even the most reliable do eventually stop working. But that is the time to start looking for a new set.
There will always be at least one tramline pair for you to trade off.
NB: Don't miss my next bit of trading advice. To receive all my spread betting blog posts by email, as soon as I've written them, just sign up here .
Get the latest financial news, insights and expert analysis from our award-winning MoneyWeek team, to help you understand what really matters when it comes to your finances.
John is is a British-born lapsed PhD physicist, who previously worked for Nasa on the Mars exploration team. He is a former commodity trading advisor with the US Commodities Futures Trading Commission, and worked in a boutique futures house in California in the 1980s.
He was a partner in one of the first futures newsletter advisory services, based in Washington DC, specialising in pork bellies and currencies. John is primarily a chart-reading trader, having cut his trading teeth in the days before PCs.
As well as his work in the financial world, he has launched, run and sold several 'real' businesses producing 'real' products.
-
 Average UK house price reaches £300,000 for first time, Halifax says
While the average house price has topped £300k, regional disparities still remain, Halifax finds.
-
 Barings Emerging Europe trust bounces back from Russia woes
Barings Emerging Europe trust has added the Middle East and Africa to its mandate, delivering a strong recovery, says Max King