Using trendlines to plan long-term trades
Trading isn't all about short-term bursts of action. Often the most profitable trades are made when you get on board a major trend and stick with it for weeks or even months. But how do you spot them? Veteran trader John Burford shares his strategy.
Get the latest financial news, insights and expert analysis from our award-winning MoneyWeek team, to help you understand what really matters when it comes to your finances.
You are now subscribed
Your newsletter sign-up was successful
Want to add more newsletters?

Twice daily
MoneyWeek
Get the latest financial news, insights and expert analysis from our award-winning MoneyWeek team, to help you understand what really matters when it comes to your finances.

Four times a week
Look After My Bills
Sign up to our free money-saving newsletter, filled with the latest news and expert advice to help you find the best tips and deals for managing your bills. Start saving today!
There is no doubt that trading with a major trend gives the very biggest profits the longer the trend, the bigger the profits. But how many of us have the discipline to stick with a trend for weeks and months? I believe that by using trendlines, the necessary discipline can be almost forced on a trader.
Of course, a trend is only a trend in hindsight. At any time, the market can decide to enter into a backing and filling period, where no trends can be discovered except very short-term ones. Or, it can just turn tail and go in the other direction.
But when a trend turns out to have staying power, it can be very profitable indeed. Here is a classic for long-term traders in the Dow.
MoneyWeek
Subscribe to MoneyWeek today and get your first six magazine issues absolutely FREE

Sign up to Money Morning
Don't miss the latest investment and personal finances news, market analysis, plus money-saving tips with our free twice-daily newsletter
Don't miss the latest investment and personal finances news, market analysis, plus money-saving tips with our free twice-daily newsletter
A long-term trade in the Dow
Back in the summer, before the second batch of quantitative easing was mooted, stocks markets were looking sickly. But instead of collapsing, stocks stabilised and by September, volatility had died down. For the remainder of the year, stocks rallied in an orderly fashion enough to call the move a trend.
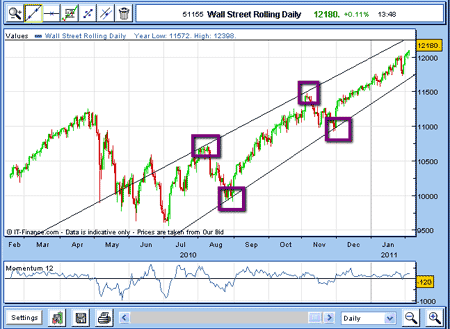
How can I say that? Simply by drawing straight lines joining the prominent highs and lows created since August (see below):

(Click on the chart for a larger version)
I have highlighted the two major peaks and two major valleys in purple. Two points are enough to create a straight line. I cannot call these tramlines, as they are not parallel. They form what we call a "rising wedge" in classical technical analysis. The lines slowly converge in time, and eventually, the market will break out of this wedge.
So, if these trendlines are valid, a projection of them into the future should give the prices at which future highs and lows will be created at points along the trendlines.
Following the wedge
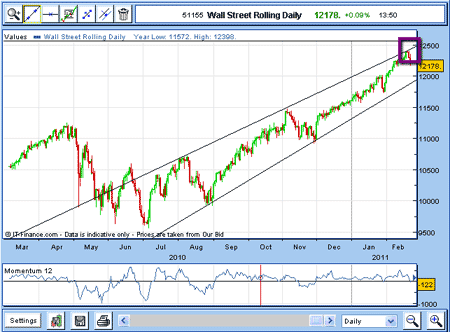
By early this year, the market had advanced along its trend and this was the picture:

(Click on the chart for a larger version)
The market did hit the 12,400 level right on the upper trendline! This level is also an exact Fibonacci retrace of the huge 2007-2009 bear market. I find these long-term Fibonacci retracements are very often highly significant, and act as turning points.
With these two co-incident points, a short sale at that level was a high-probability trade. Also, taking profits on long positions also made sense.

Claim your FREE report: The 6-step game-plan for
spread betting profits
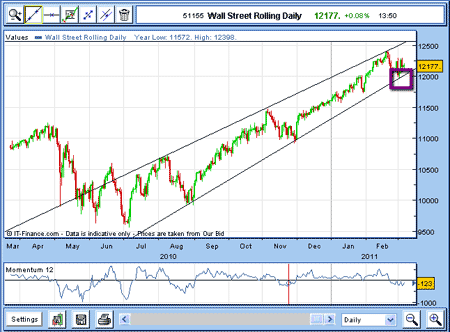
As trading moved into February, the market fell from this significant point and hit the lower trendline right at the 12,000 level (see below):

(Click on the chart for a larger version)
Any trader who was long from the summer could either exit the market at the 12,400 area, or place their moving stop to a point just under the lower trendline. As of today, the lower trendline has not been violated. And neither has the upper one! When either event occurs, that would be a significant move, and one to be traded.
NB: Don't miss my next bit of trading advice. To receive all my spread betting blog posts by email, as soon as I've written them, just sign up here .
Get the latest financial news, insights and expert analysis from our award-winning MoneyWeek team, to help you understand what really matters when it comes to your finances.
John is is a British-born lapsed PhD physicist, who previously worked for Nasa on the Mars exploration team. He is a former commodity trading advisor with the US Commodities Futures Trading Commission, and worked in a boutique futures house in California in the 1980s.
He was a partner in one of the first futures newsletter advisory services, based in Washington DC, specialising in pork bellies and currencies. John is primarily a chart-reading trader, having cut his trading teeth in the days before PCs.
As well as his work in the financial world, he has launched, run and sold several 'real' businesses producing 'real' products.
-
 Average UK house price reaches £300,000 for first time, Halifax says
While the average house price has topped £300k, regional disparities still remain, Halifax finds.
-
 Barings Emerging Europe trust bounces back from Russia woes
Barings Emerging Europe trust has added the Middle East and Africa to its mandate, delivering a strong recovery, says Max King