The 'holy grail' of gold trades
John C Burford looks at the gold market, and introduces a new tool for spotting promising trades – the horizontal tramline.
Get the latest financial news, insights and expert analysis from our award-winning MoneyWeek team, to help you understand what really matters when it comes to your finances.
You are now subscribed
Your newsletter sign-up was successful
Want to add more newsletters?

Twice daily
MoneyWeek
Get the latest financial news, insights and expert analysis from our award-winning MoneyWeek team, to help you understand what really matters when it comes to your finances.

Four times a week
Look After My Bills
Sign up to our free money-saving newsletter, filled with the latest news and expert advice to help you find the best tips and deals for managing your bills. Start saving today!
Since I began writing this blog, I have yet to show a set of horizontal tramlines until now.
The gold market, as we all know, has been in a bull market for some time, but I am always alert to potential topping action.
It is not because I am bearish on gold, it is simply because with the vast majority of traders both individual and institutional bullish and long, the potential is always there for steep drops as sell-stops are hit.
MoneyWeek
Subscribe to MoneyWeek today and get your first six magazine issues absolutely FREE

Sign up to Money Morning
Don't miss the latest investment and personal finances news, market analysis, plus money-saving tips with our free twice-daily newsletter
Don't miss the latest investment and personal finances news, market analysis, plus money-saving tips with our free twice-daily newsletter
That is why you will see sharp breaks on the chart, whereas price advances occur in a more leisurely fashion. The same phenomenon can be seen in stock price charts, and for the same reason.
Trading is confined to some very fine tramlines
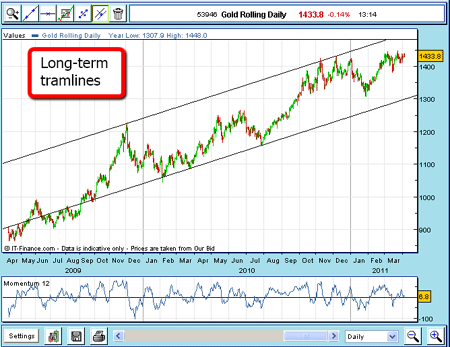
Here is the gold chart going back to 2009:

(Click on the chart for a larger version)
It shows the very fine pair of tramlines which have confined all trading since 2009. And here is the recent action going back a few months:

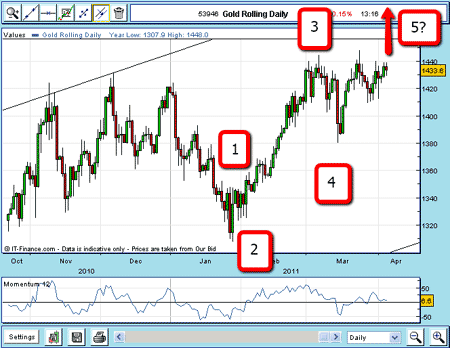
(Click on the chart for a larger version)
Trading in this period has been very choppy, to say the least! No clear trends were available, and my trading was a series of very short-term in-and-outs.
I did believe that the dip in March was the start of a major decline, but the market rallied to make a new high for this move on March 24.
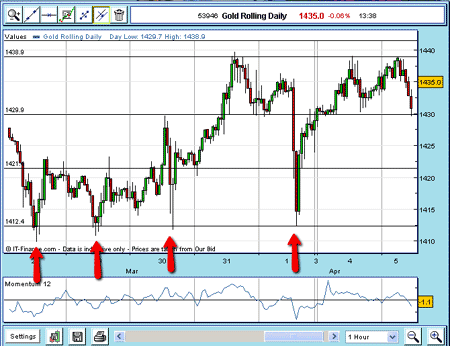
Llook at this hourly chart:

(Click on the chart for a larger version)
We see the huge dip on 1 April, and then the very impressive recovery (a good April Fool's joke?). If you were trading that day, and not watching the market, you may well have been whipsawed with that $25 down-and-up move.
Markets can be so cruel to both bulls and bears even at the same time!
I have drawn my first tramline across the tops in the $1,439 area, and then my second tramline, just beneath at the $1,429 level.
Theprice duly returned tothe lower tramline.
But look at what happens when I draw a parallel and equidistant tramline beneath my lower tramline, and then draw one below that.
This fourth tramline exactly meets the low of 1 April. And it passes through the three previous lows of 28, 29, and 30 March (marked with red arrows).
Gold's moves confirm our tramline placement
This is terrific confirmation that my tramlines are significant.
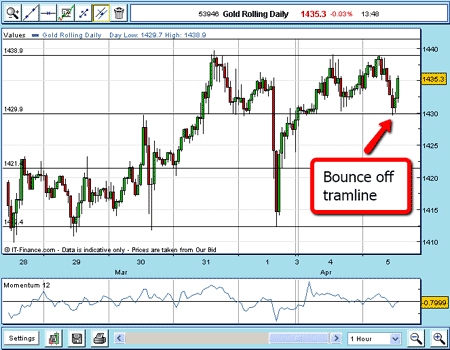
OK, so we have a tradable point at the second tramline. Let's see if this is working out:

(Click on the chart for a larger version)
Yes, indeed. The market bounces off the tramline and heads for my upper tramline.
I can now move my protective stop to break-even using my break-even rule.
No matter what happens now, I will not lose on this trade. This is the holy grail of trading (at least it is for me).
If you go back to the long-term chart, I have drawn in my Elliott wave labels, which I believe are operative. If the 1 April spike low was wave 4, we should see a new high in a wave 5.
That should be the final up-wave for now. But we need to sit back and observe what the market throws up at us from here.
I will continue this trade in a later post.
I'll be at the London Traders Expo in the Queen Elizabeth II conference centre this Saturday.
The exhibition which lasts all weekend gives you the chance to meet traders and industry experts and try out new software packages as well as picking up ideas and strategies.
And at 3:30 on Saturday I'll be talking about how to use my tramline trading methods to identify low-risk, high probability trades. You can register for the exhibition for free here .
NB: Don't miss my next bit of trading advice. To receive all my spread betting blog posts by email, as soon as I've written them, just sign up here .
Get the latest financial news, insights and expert analysis from our award-winning MoneyWeek team, to help you understand what really matters when it comes to your finances.
John is is a British-born lapsed PhD physicist, who previously worked for Nasa on the Mars exploration team. He is a former commodity trading advisor with the US Commodities Futures Trading Commission, and worked in a boutique futures house in California in the 1980s.
He was a partner in one of the first futures newsletter advisory services, based in Washington DC, specialising in pork bellies and currencies. John is primarily a chart-reading trader, having cut his trading teeth in the days before PCs.
As well as his work in the financial world, he has launched, run and sold several 'real' businesses producing 'real' products.
-
 MoneyWeek Talks: The funds to choose in 2026
Podcast Fidelity's Tom Stevenson reveals his top three funds for 2026 for your ISA or self-invested personal pension
-
 Three companies with deep economic moats to buy now
Opinion An economic moat can underpin a company's future returns. Here, Imran Sattar, portfolio manager at Edinburgh Investment Trust, selects three stocks to buy now