When is a loss not a loss? When you have hedged your trade
One spread betting technique to use when markets are getting overheated is to 'hedge' your trade. Here's what 'hedging' means and how to use it.
Get the latest financial news, insights and expert analysis from our award-winning MoneyWeek team, to help you understand what really matters when it comes to your finances.
You are now subscribed
Your newsletter sign-up was successful
Want to add more newsletters?

Twice daily
MoneyWeek
Get the latest financial news, insights and expert analysis from our award-winning MoneyWeek team, to help you understand what really matters when it comes to your finances.

Four times a week
Look After My Bills
Sign up to our free money-saving newsletter, filled with the latest news and expert advice to help you find the best tips and deals for managing your bills. Start saving today!
One technique I like to use when markets are getting overheated (and I have a good position), is to hedge that trade. That way, I can keep my original position open and retain the gain already made.
First, let's talk about what hedging actually means. There is so much ill-informed talk decrying 'hedge funds' and their 'nefarious' activities. For starters, most hedge funds that take the flak are not really true hedge funds. Instead, they can and do take mammoth long-only or short-only positions unhedged by offsetting trades elsewhere. They are acting as simple investment funds albeit with a lot of clout.
A true hedge fund is one whose main assets are in positions which are hedged with an offsetting position in a related market. For instance, a fund may be long a basket of oil stocks.
MoneyWeek
Subscribe to MoneyWeek today and get your first six magazine issues absolutely FREE

Sign up to Money Morning
Don't miss the latest investment and personal finances news, market analysis, plus money-saving tips with our free twice-daily newsletter
Don't miss the latest investment and personal finances news, market analysis, plus money-saving tips with our free twice-daily newsletter
The manager may have deduced that if the oil price keeps rising, dividends will increase, and the fund's holding will gain in value.
To hedge this exposure, the fund may be short a basket of, say, retail stocks, which would suffer from an increased oil price (because higher petrol prices mean less disposable consumer income). The manager may even have worked out an algorithm for the correct ratio of long and short positions to maximise the expected profit.
From a macro perspective, if the general stock market (say the Dow) falls significantly, there is an expectation that the oil stocks would fall less than the retail stocks, providing a profit from the widening spread. And, if the Dow rises, the oil stocks should gain relative to the retail sector.
Hedge funds scour the earth for these win-win situations. Of course, some work out and some don't. But the main area of investment for hedge funds is in government and corporate bonds and their many derivatives, most notably CDS (credit default swaps, or default insurance). Banks and funds use complicated proprietary methods for trading these between themselves.
But as simple spread-betting traders, we can ignore these, and concentrate on trading US Treasuries ('T-bonds') against the stock market indices. Most of the time, these markets have a near-100% inverse correlation with each other. In other words, when stocks rise, Treasuries usually fall.
So, a profitable long Dow position could be hedged with a suitable long Treasury trade. And interestingly - at least, before the second round of quantitative easing (QE2) - I have noticed that for every 100-pip move in the Dow, there is an approximate 100-pip move in the 30-Year T-bonds. That makes it an easy calculation for a hedge trade.
For every £1 bet in the Dow, we can bet £1 in the bonds.
Here is a great example of one of my recent Dow/T-bond hedge trades:

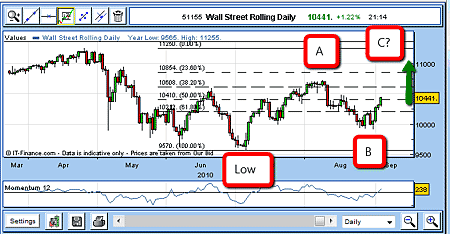
In early August, I was anticipating a top in the Dow. On 10 August (see point A on the chart above), I got my signal and entered a sell order at 10,595, which was quickly filled. I entered my protective stop right away at 10,725 for a 130 pip risk, which was well within my 3% rule.
As the market peeled away, over the next few days, I noted that the T-bonds rallied in sympathy. So far, so good.
Then, on 25 August, the Dow made a new low just under the previous low of precisely 10,000 on 20 July. That's where it found support (see point B), rallied to 10,200 and then fell again into 30 August.
If my analysis was correct, the market should have continued falling, but the very next day, the Dow started a big rally.
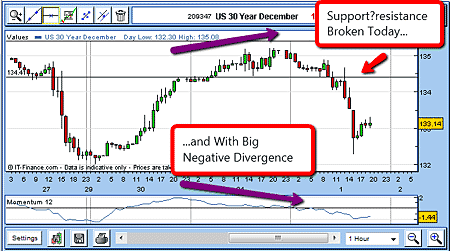
I was waiting for something to give here, and had in place a sell stop order in the T-bonds, which was showing signs of topping:

A sell-stop just under support at 134.30 would be a logical place to enter. I didn't have long to wait I was stopped in on 1 September as you can see on the above chart. At the same time, the Dow was moving up very smartly.
So now I was hedged. If the Dow rallied further, eroding my gains here, I would be making a gain on my short T-bond leg. I could sleep easier!
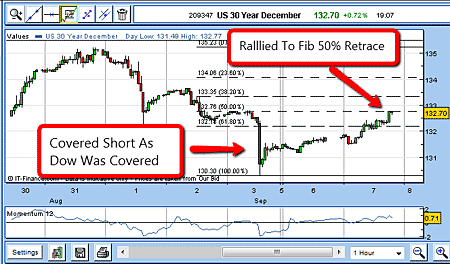
Then, as bonds spiked down on 4 September, and the Dow continued rallying to a Fibonacci retrace, I realised that the Dow was moving up further than I had expected, so I went for the exit. I decided to abandon both positions until the fog cleared.

On 3 September, I covered both trades for the following results:
10 Aug sold £1 Dow @ 10,595.
Stop @ 10,725 for £130 risk (2.6%)
4 Sept covered @ 10,350.
Gain £245 for risk of £130
1 Sept sold £1 Sept T-bonds @ 134.40 (no stop)
4 Sept covered @ 131.
Gain £340
Net profit £585 (If no hedge, the gain would have been £245)
These situations do not come along very often, but when markets are pulling one way then the other, as they surely did this summer, we need to be ready to use all of the weapons in our armoury.
Get the latest financial news, insights and expert analysis from our award-winning MoneyWeek team, to help you understand what really matters when it comes to your finances.
John is is a British-born lapsed PhD physicist, who previously worked for Nasa on the Mars exploration team. He is a former commodity trading advisor with the US Commodities Futures Trading Commission, and worked in a boutique futures house in California in the 1980s.
He was a partner in one of the first futures newsletter advisory services, based in Washington DC, specialising in pork bellies and currencies. John is primarily a chart-reading trader, having cut his trading teeth in the days before PCs.
As well as his work in the financial world, he has launched, run and sold several 'real' businesses producing 'real' products.
-
 ISA fund and trust picks for every type of investor – which could work for you?
Whether you’re an ISA investor seeking reliable returns, looking to add a bit more risk to your portfolio or are new to investing, MoneyWeek asked the experts for funds and investment trusts you could consider in 2026
-
 The most popular fund sectors of 2025 as investor outflows continue
It was another difficult year for fund inflows but there are signs that investors are returning to the financial markets