Look out! Gold has reached a critical level
Action in the gold market has been fast and furious. And now it's approaching a critical level. John C Burford looks to the charts to see where the gold price is likely to go next.
Get the latest financial news, insights and expert analysis from our award-winning MoneyWeek team, to help you understand what really matters when it comes to your finances.
You are now subscribed
Your newsletter sign-up was successful
Want to add more newsletters?

Twice daily
MoneyWeek
Get the latest financial news, insights and expert analysis from our award-winning MoneyWeek team, to help you understand what really matters when it comes to your finances.

Four times a week
Look After My Bills
Sign up to our free money-saving newsletter, filled with the latest news and expert advice to help you find the best tips and deals for managing your bills. Start saving today!
On Monday I told you I was still looking to short gold.
And I want to look at gold again today because there has been a major development since.
I said last time that the action in gold would be fast and furious. That's exactly what's happened - with wide swings both up and down this week.
MoneyWeek
Subscribe to MoneyWeek today and get your first six magazine issues absolutely FREE

Sign up to Money Morning
Don't miss the latest investment and personal finances news, market analysis, plus money-saving tips with our free twice-daily newsletter
Don't miss the latest investment and personal finances news, market analysis, plus money-saving tips with our free twice-daily newsletter
This morning as I write, gold is falling to one of my tramlines. So I'm now trying to work out where it could go from here.
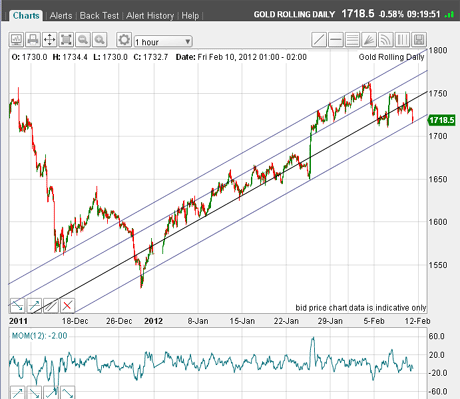
I showed you an hourly gold chart on Monday that had a set of four tramlines. Below is the same chart, updated.
There's some interesting action here. Can you see how from this week's highs, the market is falling and is currently challenging the lowest tramline?
Well it's here that I expect at least a pause in the decline.

(Click on the chart for a larger version)
Gold is approaching a critical area
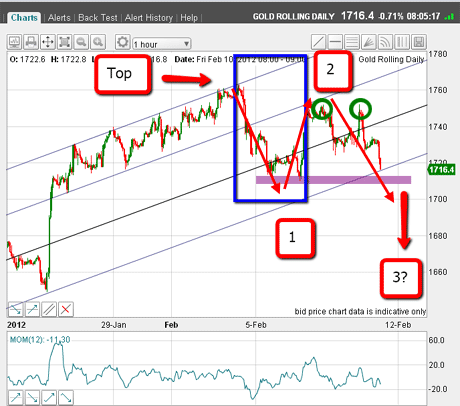
In a moment, we'll zoom in a bit closer. I'll show you where I have drawn in a critical area marked by my purple bar. I'm watching it very closely.
If the market can sweep this aside, it would confirm with very high probability that gold is headed lower much lower in a large third Elliott wave.
Here's the close-up chart:

(Click on the chart for a larger version)
That purple bar is critical because it represents both support from the previous lows in the $1,710-1,715 area, and the tramline support area.
From Monday's analysis, I identified the small scale wave pattern enclosed in the blue box as a five-wave pattern (slightly modified from my original labelling). This pattern type clinches the $1,762 high made on 3 February as the top of the bear market rally with high confidence. I've labelled that top.
The key on Monday was that any rally from Tuesday's low would not exceed this high. If the market did manage to rally above $1,762, that would cancel my Elliott wave analysis.
It would have been back to the drawing board for me.
This could be the start of a major move down
As it happened, the market did rally, but not to the $1,762 level. It got as far as the $1,752 highs (two attempts at this level, which I've circled).
Here's the chart again so you don't need to scroll up:

(Click on the chart for a larger version)
If my labels are correct, the initial small-scale five-wave pattern (in the blue box) is a larger wave 1 down, the rally to the $1,752 area is wave 2 up, and gold is at the starting gates of a very large wave 3 down or perhaps a C wave.
To increase my confidence of this five-wave interpretation, I would need to see a take-out of the $1,710-1,715 area fairly soon.
Why? Because third waves are normally long and strong' and relentless in their scope. They take no prisoners.
Of course, there is an alternative labelling scenario this wave down could be a C wave (of an A-B-C correction) and lead to another huge rally. We'll need to wait and see.
Gold is almost at my first target
Recall from Monday's email, I wrote: "But breaking below Friday's low would confirm my analysis and indicate a much more severe decline lies directly ahead. My first major target is the $1,660 area, with $1,710 as a minor stopping-point (these are Fibonacci levels)."
OK, the market is near my first $1,710 target already. Now I wait to see if my second one could be reached. That would help me identify this move down as a genuine third wave, rather than a C wave.
I hope you are seeing how very useful a basic knowledge of Elliott wave theory can be. Just look at what it allows me to do.
I have been able to say with some confidence that following the small-scale five-wave pattern down off the $1,762 level, that gold has reversed its rally.
At the same time, if that $1,762 level is exceeded on a rally, it would cancel my forecast for a reversal. That is important information, as it allows me to see what could lie ahead, with only a few possible options. And it's all down to my understanding of Elliott wave theory.
Contrast that with someone who simply trades on hunch, on emotions, even on 'fundamentals' alone. When the market goes against the trader, they are left with no road map, and are apt to make hasty decisions usually to their disadvantage.
Although it cannot guarantee results, the methodology I use to analyse the markets is a scientific one one based on empirical rules and guidelines. It's not based on an emotional value judgment of the fundamentals as I interpret them.
Remember, for every buyer there is a seller. If, say, I buy into the arguments as to why gold is a screaming buy, I am trading emotionally, not scientifically. And who is selling to me? They must be crazy, surely? Can't they see that gold is a huge buy?
If I stand back a little, I might see that maybe the sellers know something I don't. What a sobering thought!
Anyway, my point is: learn about Elliott waves. I think it can help you to be a better trader. If you've not seen my video tutorials yet, have a look here:
An introduction to Elliott wave theory
Advanced trading with Elliott waves
The thorny issue of stop-loss placement
Just before I leave you today, I have had several questions from readers that ask me how I set my protective stops and how should they do it for their own trading.
This is one of the biggest cans of worms in all of trading. It's a big topic and one that needs a bit more space. So I will write on this very subject shortly.
I shall be on holiday from 21 - 29 February and this would be a good time to get it out to you.
For now, what I would say is that your choice of stop placement is highly dependent on what style of trader you are, on whether you sell weakness/buy strength. It is very much a case of horses for courses, I'm afraid.
And we'll have another look at the euro soon. It's still above 1.32 as I write (just!), but volatility remains. I think there's going to be some good action in that market in the days ahead. I'll let you know what I see soon.
If you're a new reader, or need a reminder about some of the methods I refer to in my trades, then do have a look at my introductory videos:
The essentials of tramline trading
An introduction to Elliott wave theory
Advanced trading with Elliott waves
Don't miss my next trading insight. To receive all my spread betting blog posts by email, as soon as I've written them, just sign up here .
Get the latest financial news, insights and expert analysis from our award-winning MoneyWeek team, to help you understand what really matters when it comes to your finances.
John is is a British-born lapsed PhD physicist, who previously worked for Nasa on the Mars exploration team. He is a former commodity trading advisor with the US Commodities Futures Trading Commission, and worked in a boutique futures house in California in the 1980s.
He was a partner in one of the first futures newsletter advisory services, based in Washington DC, specialising in pork bellies and currencies. John is primarily a chart-reading trader, having cut his trading teeth in the days before PCs.
As well as his work in the financial world, he has launched, run and sold several 'real' businesses producing 'real' products.
-
 ISA fund and trust picks for every type of investor – which could work for you?
Whether you’re an ISA investor seeking reliable returns, looking to add a bit more risk to your portfolio or are new to investing, MoneyWeek asked the experts for funds and investment trusts you could consider in 2026
-
 The most popular fund sectors of 2025 as investor outflows continue
It was another difficult year for fund inflows but there are signs that investors are returning to the financial markets