Has the Dow topped out?
The recent rally in the Dow Jones may have marked an important top. John C Burford looks at how to play the market from here.
Get the latest financial news, insights and expert analysis from our award-winning MoneyWeek team, to help you understand what really matters when it comes to your finances.
You are now subscribed
Your newsletter sign-up was successful
Want to add more newsletters?

Twice daily
MoneyWeek
Get the latest financial news, insights and expert analysis from our award-winning MoneyWeek team, to help you understand what really matters when it comes to your finances.

Four times a week
Look After My Bills
Sign up to our free money-saving newsletter, filled with the latest news and expert advice to help you find the best tips and deals for managing your bills. Start saving today!
On Wednesday, when I wrote on gold (which also is at a very interesting juncture today), I promised to cover the Dow today and what a day to be following this up!
The last time I wrote on the Dow, the market had dropped down to the 11,500 area. I said then that I expected a bounce based upon my reading of the Elliott waves, and the bounce might take the form of an A-B-C correction.
Little did I know that the subsequent 'bounce' would take the market way back up to the 12,300 area an area that contained significant highs from previous trading. That was an up-move of around 800 pips, which I missed out on.
MoneyWeek
Subscribe to MoneyWeek today and get your first six magazine issues absolutely FREE

Sign up to Money Morning
Don't miss the latest investment and personal finances news, market analysis, plus money-saving tips with our free twice-daily newsletter
Don't miss the latest investment and personal finances news, market analysis, plus money-saving tips with our free twice-daily newsletter
Now, you could ask why I did not trade from the long side here. A good question!
Because I am mediumtolong-term bearish the market, unless I see a hugely oversold condition (revealed by very low momentum readings), and at the same time, see the market is in a zone of strong support, I resist the temptation to trade from the long side.
I would rather wait for rallies to reverse.
In bear markets, rallies can fizzle out very quickly (yesterday was a great example, as I will show later), and I would rather go with the flow than swim upstream. It is the 'easier' way to making profits, if there is such a thing.
So what happened in the Dow?
As we all know, the market's eyes have been firmly fixed on the eurozone crisis, and this recent rally to the 12,300 area has been prompted by the Panglossian hope that all be well in the best of all possible worlds.
As feet-on-the-ground traders, it is usually best to take the other side of that trade! Hope is rarely a sound basis for trading.
That is why I was looking to short the market on the way up.
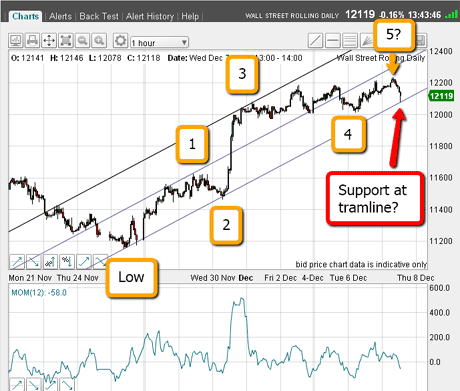
On Wednesday, I believed I had the Elliott wave pattern of the rally nailed. And just to show how tough it is to get the count correct in real time, here is the chart I made on Wednesday:

(Click on the chart for a larger version)
I have my very good tramlines in place, and my count looks OK. My wave 5 has just made it into new high ground, and that should have been the signal for the market to start falling from there, if the lower tramline could be penetrated.
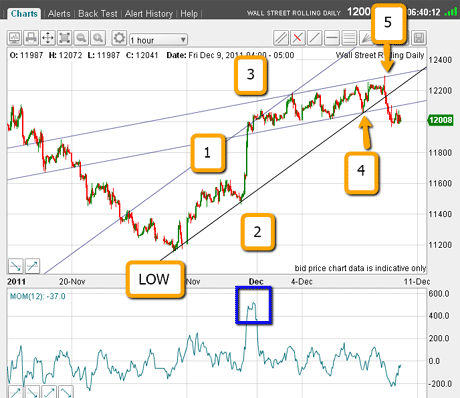
But there was still life in the rally yet. Here is today's chart showing the market pushing up to the 12,300 level:

(Click on the chart for a larger version)
This is a much better-looking count now. Waves 2 and 4 lie on my lower tramline, and there is a huge negative momentum divergence at wave 5. Wave 3 sports a very high momentum reading (blue box).
The other interesting point is that I can draw another tramline pair across the most recent trading (the shallower sloped pair).
Setting a new target to the downside
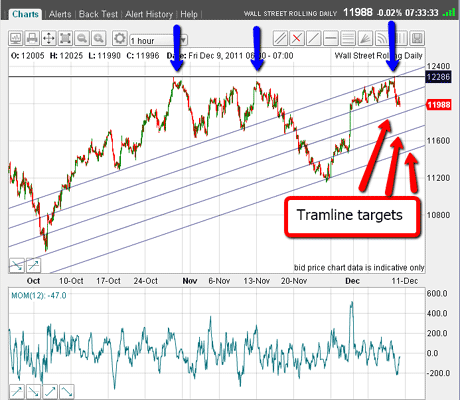
Let's see if this tramline pair finds significant anchor points in previous trading. Here is the chart going back to October:

(Click on the chart for a larger version)
The uppermost lines are my original pair, and you can see that I do indeed have great anchor points just admire the way the major lows from late October/November are touched. I like that!
From this pair, I have drawn equidistant and parallel tramlines, and these are now my downside targets.
Also see how the fourth tramline from the top one has touched the major early October low.
But the significant point is that the market tried to push past the major resistance at 12,300 (marked by the blue arrows) and failed.
Yesterday may have marked an important top
Yesterday was a 'key reversal' day, which is a day where a new rally high was made, and the market closed below Thursday's close. Sometimes, these key reversals flag important tops.
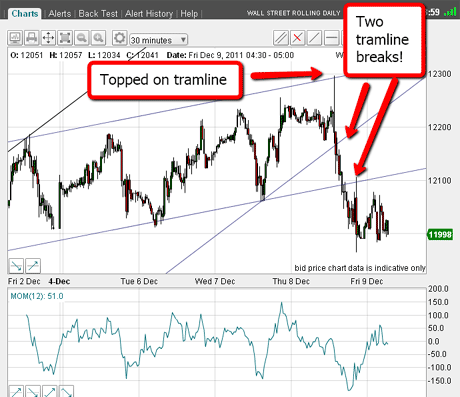
Naturally, according to my style of trading, short sales could have been made close to the 12,300 top (where it met the upper tramline), or on either of the two breaks of the tramlines.
Here is the action in close-up:

(Click on the chart for a larger version)
The first tramline was sliced through, and then the second tramline, but then the market came back up and 'kissed' that tramline a very typical behaviour.
OK, it appears that I have identified a major top what now?
The market could rally back to the underside of the first tramline in the 12,200 area, but first, it must overcome resistance at the lower tramline in the 12,100 area. This should be formidable resistance.
In the medium-term, I am expecting some of my lower tramline targets to be made.
But if the market rallies back to the 12,200 area, I will need to reassess, but at least, I have some markers that will guide my trading.
Having plans that cover any eventuality is the key to relatively stress-free trading. It is usually disastrous to be floundering around in the markets without such plans, and is one reason why so many traders fail.
If you're a new reader, or need a reminder about some of the methods I refer to in my trades, then do have a look at my introductory videos:
The essentials of tramline trading
An introduction to Elliott wave theory
Advanced trading with Elliott waves
Don't miss my next trading insight. To receive all my spread betting blog posts by email, as soon as I've written them, just sign up here .
Get the latest financial news, insights and expert analysis from our award-winning MoneyWeek team, to help you understand what really matters when it comes to your finances.
John is is a British-born lapsed PhD physicist, who previously worked for Nasa on the Mars exploration team. He is a former commodity trading advisor with the US Commodities Futures Trading Commission, and worked in a boutique futures house in California in the 1980s.
He was a partner in one of the first futures newsletter advisory services, based in Washington DC, specialising in pork bellies and currencies. John is primarily a chart-reading trader, having cut his trading teeth in the days before PCs.
As well as his work in the financial world, he has launched, run and sold several 'real' businesses producing 'real' products.
-
 Can mining stocks deliver golden gains?
With gold and silver prices having outperformed the stock markets last year, mining stocks can be an effective, if volatile, means of gaining exposure
-
 8 ways the ‘sandwich generation’ can protect wealth
People squeezed between caring for ageing parents and adult children or younger grandchildren – known as the ‘sandwich generation’ – are at risk of neglecting their own financial planning. Here’s how to protect yourself and your loved ones’ wealth.