My short trade in gold pays off
John C Burford describes a beautiful two-day trade in gold, and looks at where the market might be heading next.
Get the latest financial news, insights and expert analysis from our award-winning MoneyWeek team, to help you understand what really matters when it comes to your finances.
You are now subscribed
Your newsletter sign-up was successful
Want to add more newsletters?

Twice daily
MoneyWeek
Get the latest financial news, insights and expert analysis from our award-winning MoneyWeek team, to help you understand what really matters when it comes to your finances.

Four times a week
Look After My Bills
Sign up to our free money-saving newsletter, filled with the latest news and expert advice to help you find the best tips and deals for managing your bills. Start saving today!
On Monday, I gave an excellent set-up for a short trade in gold. The market had made a precise Fibonacci retrace of a previous down-wave to the $1,760 level.
For that and various other reasons, it looked very likely to me that the market would decline off that $1,760 level and present me with a low-risk trade.
And what a beautiful two-day trade that was, as I hope to show you now.
MoneyWeek
Subscribe to MoneyWeek today and get your first six magazine issues absolutely FREE

Sign up to Money Morning
Don't miss the latest investment and personal finances news, market analysis, plus money-saving tips with our free twice-daily newsletter
Don't miss the latest investment and personal finances news, market analysis, plus money-saving tips with our free twice-daily newsletter
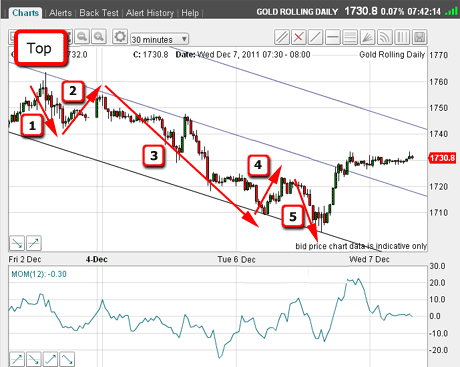
First, below is the 30-minute chart showing market action since Monday.
From that $1,760 top (marked on the chart below), the market declined in a series of waves all contained within my tramline pair (I shall show you how I placed the lines in a moment).

(Click on the chart for a larger version)
These waves are all described by textbook Elliott wave theory:
Wave 2 rallied back to top out just under the $1,760 top. Then the market went on to drop beneath the wave 1 low. It was then that I suspected we were in the early stages of a third wave, but I needed solid confirmation by seeing the market plunge down immediately and that is precisely what I got.
Wave 3 is "long and strong" with weak momentum (strongly down). Also, there is a 5-wave minor pattern within this wave this is impulsive, and shows the main trend is down. When you see this pattern, it almost always indicates lower lows ahead.
And wave 5 was put in as it met the lower tramline and with a large positive momentum divergence.
This is about as perfect a completed Elliott wave as we will ever see and it was unfolding in real time on my screen. Naturally, I was very pleased to see it, as I was short!
Of course, we can all look over old charts and spot 'obvious' patterns, but there is nothing like the excitement you get when you see an expected pattern develop in real time.
Finding the best place to enter the market
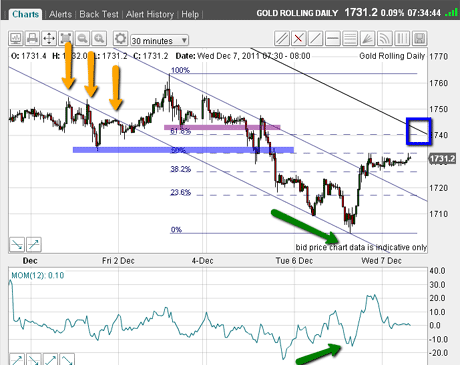
OK, back to Monday's entries. I had said that the perfect entry point was close to the $1,760 top. But failing that, I marked other possible entries by the coloured bars where minor support lurked.
Here they are on this chart (marked by the purple and blue bars):

(Click on the chart for a larger version)
Of course, I was taking profits near the lows. That was a nice trade. But I did not want to hang around too long here, as that huge positive momentum (marked by the bottom green arrow) divergence was starting to scare me!
Now back to my tramlines. I placed the lower line using the excellent touch-points indicated by the yellow arrows. As I have pointed out before, I like to use touch-points that pre-date the formation of my tramlines.
For some unknown reason, they seem to set the pattern for later trading. It is really uncanny.
See how the market made two touches to this line yesterday (Tuesday 6 December) in the $1,710 area, as it was putting in the lows.
My upper tramline was easy to draw with the three main touch-point highs (the first is on Friday 2 December, just above where the purple line starts on the chart above).
So now I can draw in the third equidistant tramline. This line will be important as I attempt to fix an upper target for the current rally.
What now for gold?
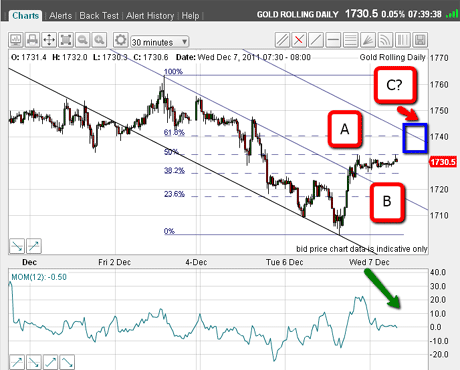
Note that the completed 5-wave pattern indicates that the larger trend is down, but first, we can expect a corrective bounce, usually in the form of an A-B-C.
On the above chart, I have drawn in the Fibonacci retrace levels that are currently operating.
Now I can fix a target where I will be looking to re-establish short positions.

(Click on the chart for a larger version)
The market is this morning trading at the $1,730 level and has made rudimentary waves A (from the Tuesday 6 December low to the 50% retracement line) and B.
I am now looking for the C wave to be put in.
And my best guess is that wave C will appear where the Fibonacci 62% retrace and my third tramline cross at the $1,740 area (marked by the blue box).
Wouldn't that be pretty?
Because of the intense interest in stocks, which seem to be defying gravity, I will be covering the Dow on Friday.
If you're a new reader, or need a reminder about some of the methods I refer to in my trades, then do have a look at my introductory videos:
The essentials of tramline trading
An introduction to Elliott wave theory
Advanced trading with Elliott waves
Don't miss my next trading insight. To receive all my spread betting blog posts by email, as soon as I've written them, just sign up here .
Get the latest financial news, insights and expert analysis from our award-winning MoneyWeek team, to help you understand what really matters when it comes to your finances.
John is is a British-born lapsed PhD physicist, who previously worked for Nasa on the Mars exploration team. He is a former commodity trading advisor with the US Commodities Futures Trading Commission, and worked in a boutique futures house in California in the 1980s.
He was a partner in one of the first futures newsletter advisory services, based in Washington DC, specialising in pork bellies and currencies. John is primarily a chart-reading trader, having cut his trading teeth in the days before PCs.
As well as his work in the financial world, he has launched, run and sold several 'real' businesses producing 'real' products.
-
 Can mining stocks deliver golden gains?
With gold and silver prices having outperformed the stock markets last year, mining stocks can be an effective, if volatile, means of gaining exposure
-
 8 ways the ‘sandwich generation’ can protect wealth
People squeezed between caring for ageing parents and adult children or younger grandchildren – known as the ‘sandwich generation’ – are at risk of neglecting their own financial planning. Here’s how to protect yourself and your loved ones’ wealth.