Now the gold price is following my script
Expect large swings in the gold price over the next few months, says John C Burford. Here's how traders can profit by following the charts.
Get the latest financial news, insights and expert analysis from our award-winning MoneyWeek team, to help you understand what really matters when it comes to your finances.
You are now subscribed
Your newsletter sign-up was successful
Want to add more newsletters?

Twice daily
MoneyWeek
Get the latest financial news, insights and expert analysis from our award-winning MoneyWeek team, to help you understand what really matters when it comes to your finances.

Four times a week
Look After My Bills
Sign up to our free money-saving newsletter, filled with the latest news and expert advice to help you find the best tips and deals for managing your bills. Start saving today!
Last Friday, I made a case for a decent rally in gold off the 31 December $1,182 low. This was based on my analysis of the Elliott waves and the record low bullish sentiment. I also referred to my tramline signal on the hourly chart.
One of the most overused myths of trading is this: never try to pick tops and bottoms. This is basically a warning to only trade with the trend.
But I say this: a trend has to start somewhere, so why not try to get in at the earliest possible opportunity? That way, you stand a chance of making a really big profit. And that's not a bad thing, is it?
MoneyWeek
Subscribe to MoneyWeek today and get your first six magazine issues absolutely FREE

Sign up to Money Morning
Don't miss the latest investment and personal finances news, market analysis, plus money-saving tips with our free twice-daily newsletter
Don't miss the latest investment and personal finances news, market analysis, plus money-saving tips with our free twice-daily newsletter
After all, there is no use in jumping on a tiring trend when its direction is already obvious to every trader and his dog. That is when surprises are most likely to occur. And you will have committed the sin of sins by joining the herd!
The benefit of using tramlines, Elliott waves and Fibonacci levels
You see, when a trend is undergoing a change in direction, most traders are on the wrong side of the market; sometimes by an overwhelming majority. The COT (commitment of traders) data can help identify these situations.
For instance, the futures holdings of speculators versus commercials in the Nasdaq has recently hit an 11 to one ratio of bulls to bears. My eyes nearly popped out when I saw this because that's probably the most extreme lopsidedness that I can recall in any market.
This places the Nasdaq in a very vulnerable situation. That's because a small reversal from the solid uptrend is likely to turn into a major rout. And these are the situations a trader should exploit to the max.
Keep an eye on the commercials
Incidentally, it is time well spent to peruse the COT data issued every Friday and pick out any glaring examples of extreme bullish or bearish holdings of the speculators. Also, note the position of the commercials (the smart money guys). If they are overwhelmingly on one side, then try to find a good reason to join them.
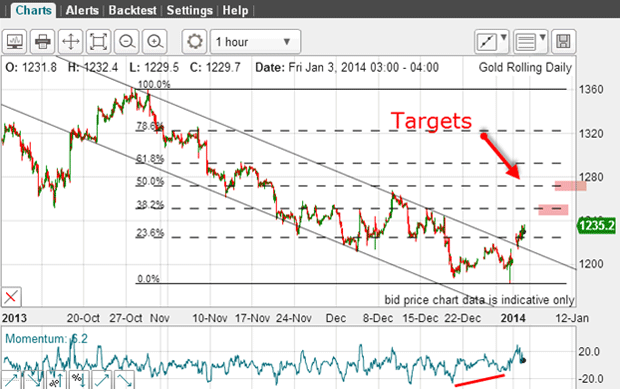
This was the hourly chart last week:

The market had rallied across my upper tramline giving a buy signal, and I had my upside targets. My roadmap forecast a high, then a dip, and then a rally to a new high for the move.
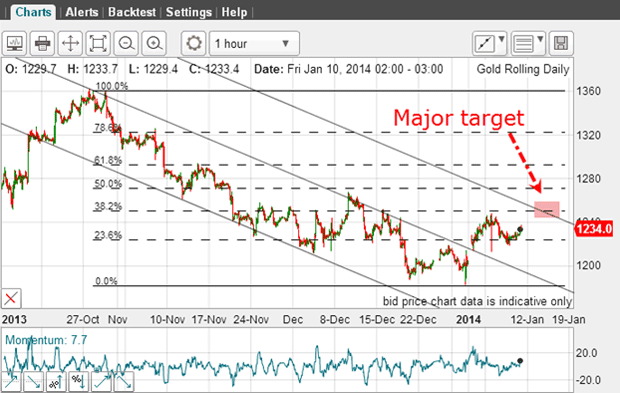
This is the picture this morning:

This week, the market has moved up nicely, but suffered one of those gold moments by spiking down and then back up in a flash. This was the market's attempt to kiss the centre tramline, which is a normal event. The market quickly re-asserted itself and went on to hit the Fibonacci 38% level before dipping again. And this morning, it is in rally mode.
Waiting for the market to speak

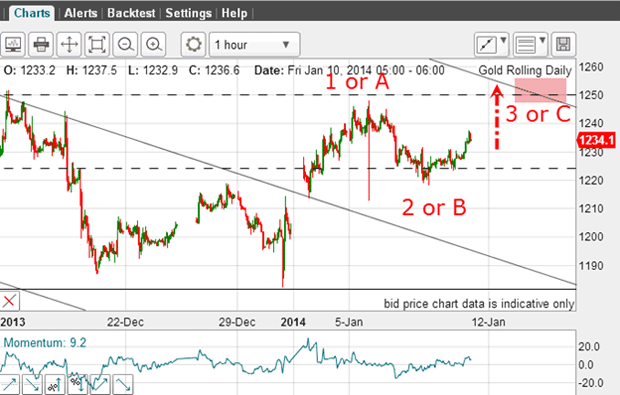
I have two options for the wave labels on this rally. The first wave up is either wave 1 or wave A (of an A-B-C). The dip is either wave 2 or wave B, and the current wave could be wave 3 or wave C.
So far, there is no earthly way to forecast which count will turn out to be correct we need to wait for the market to tell us. One clue to look for is if the market really takes off to the upside. That would suggest we have a wave 3, because third waves are long and strong. If the market nervously edges up, then we likely have a C wave. And when that ends, the market should resume its decline. This is because A-B-Cs are counter-trend.
But under either scenario, my initial target remains the $1,250 area. If and when it reaches that level, the only thing I can do is observe market action to allow it to tip its hand. If we have a wave 3, then this target may well be blown away and the next target becomes the 50% level at around the $1,270 level. And if the market really takes off, the 62% level at $1,290 is possible.
Looking at the bigger picture
In terms of the bigger picture, the major trend in gold is still down. Any rally must be seen as a large counter-trend rally (with new lows under $1,180 beckoning). But if we do see a small-scale five-wave pattern up, as discussed above, then all bets are off and a major trend change may be in the making.
I have a feeling that the market will be subject to very large swings over the next few months, and excellent swing trading set-ups will be available. It is a market I shall be following very closely.
Get the latest financial news, insights and expert analysis from our award-winning MoneyWeek team, to help you understand what really matters when it comes to your finances.
John is is a British-born lapsed PhD physicist, who previously worked for Nasa on the Mars exploration team. He is a former commodity trading advisor with the US Commodities Futures Trading Commission, and worked in a boutique futures house in California in the 1980s.
He was a partner in one of the first futures newsletter advisory services, based in Washington DC, specialising in pork bellies and currencies. John is primarily a chart-reading trader, having cut his trading teeth in the days before PCs.
As well as his work in the financial world, he has launched, run and sold several 'real' businesses producing 'real' products.
-
 ISA fund and trust picks for every type of investor – which could work for you?
Whether you’re an ISA investor seeking reliable returns, looking to add a bit more risk to your portfolio or are new to investing, MoneyWeek asked the experts for funds and investment trusts you could consider in 2026
-
 The most popular fund sectors of 2025 as investor outflows continue
It was another difficult year for fund inflows but there are signs that investors are returning to the financial markets