The gold market starts 2014 with a bang
The new year has got off to a flying start in gold, says John C Burford. And there could be plenty more to come.
Get the latest financial news, insights and expert analysis from our award-winning MoneyWeek team, to help you understand what really matters when it comes to your finances.
You are now subscribed
Your newsletter sign-up was successful
Want to add more newsletters?

Twice daily
MoneyWeek
Get the latest financial news, insights and expert analysis from our award-winning MoneyWeek team, to help you understand what really matters when it comes to your finances.

Four times a week
Look After My Bills
Sign up to our free money-saving newsletter, filled with the latest news and expert advice to help you find the best tips and deals for managing your bills. Start saving today!
Welcome to the New Year! 2014 started off with a bang. And that wonderful fireworks display is beginning to shake the complacency out of many markets. Right from the kick-off yesterday, stocks are under great pressure. This is particularly true for crude oil and, crucially, Dr Copper.
I will cover stocks in due course, but today I will focus on the situation in the gold market. Over the holidays, many were wondering if 2014 will be as dreadful for the gold bulls as was 2013.
The mainstream media are currently full of negative stories of how bad 2013 actually was, suggesting it was a year to forget. Naturally, this tide of negative press has me looking the other way and wondering if 2014 might be a stellar year for precious metals.
MoneyWeek
Subscribe to MoneyWeek today and get your first six magazine issues absolutely FREE

Sign up to Money Morning
Don't miss the latest investment and personal finances news, market analysis, plus money-saving tips with our free twice-daily newsletter
Don't miss the latest investment and personal finances news, market analysis, plus money-saving tips with our free twice-daily newsletter
A good time to look for a turn
We have had well-publicised stories of one prominent gold bull who has been dumping his gold ETFs (exchange-traded funds), saying "I see no reason to be holding gold now". It is stories like this that often appear at major lows.
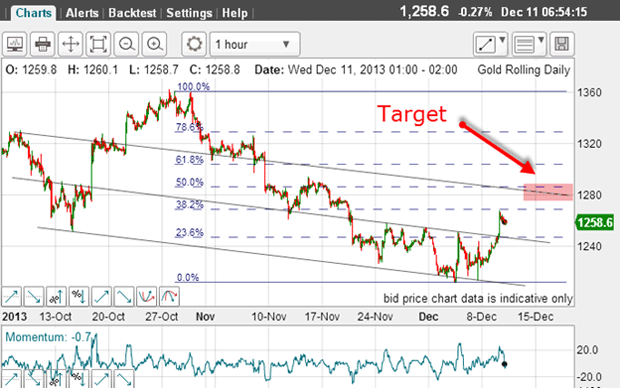
I last covered gold on 11 December. At that time, I wondered if it was making a turn. There were some initial signs that the relentless downtrend had at least paused. This was the chart then:

I had a good tramline trio and the market was moving up nicely towards my upper tramline following the break of the centre tramline. But the move off the low was looking very much like an A-B-C to that point, which is a corrective pattern to the main downtrend. Also, I was not convinced the Elliott waves(EW) had formed a complete five-wave impulse pattern from which I could infer a trend change.
In fact, the market did top out at the $1,266 level and resumed its downtrend. Interestingly, this $1266 level was a precise Fibonacci 38% retrace of the wave down from the $1,360 high from October (see above chart). The reversal back down at that point was therefore not too surprising.
Gold comes under pressure when stocks rally
It has been noticeable for some time that when the stock market was in rally mode (that is, most of the time), gold was under pressure.
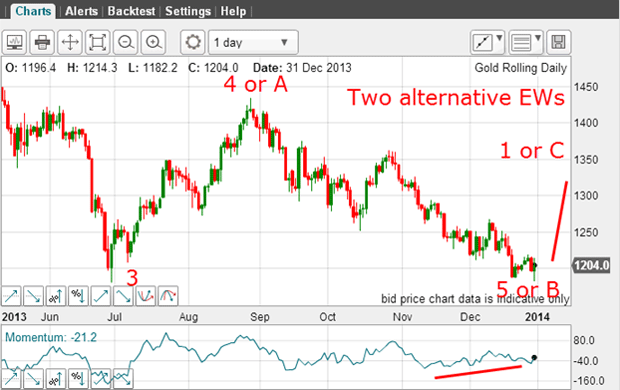
And this is how the market has played out. Here is the daily chart, and I have drawn two possible EW label interpretations:

Last week, the market made a low of $1,182, which could place it at the end of wave 5, or if the wave 4 is really an A wave, within a more complex fourth wave. Then last week's low could be wave B of an A-B-C.
But under either scenario, we should get a rally provided the move down from the August high is complete. And that is the question I have had over the holidays (which seems to be answered in the affirmative with this morning's gains).
One additional factor going for a turn now is the positive-momentum divergence (red bar). This suggests the selling pressure is starting to dry up.
What can the hourly chart reveal?

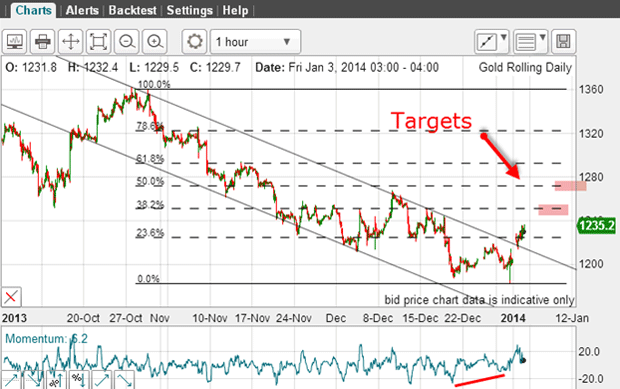
Not only that, but it opened up above the tramline and created an opportunity to take a long position. And note the positive-momentum divergence at Tuesday's low, which is another bullish signal.
Along with the upper tramline break, my targets are the Fibonacci levels at 38% and then 50%. Of course, higher targets are possible if and when these are reached.
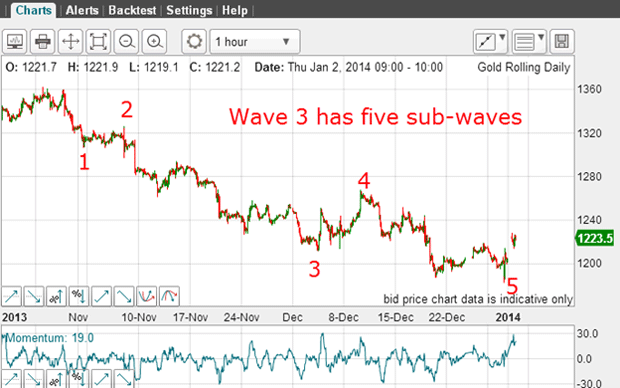
Now, can I count the decline off the $1360 level complete in EW terms? If I can count five clear waves, then that would add to my bullish case.

Here are my EW labels and the count is complete. I have a clear five sub-wave pattern within wave 3, and there is the positive-momentum divergence at wave 5.
Identifying a roadmap
In either case, the most common path is for a wave up, then a down wave and then another higher wave up
Off my wave 5 low, the market has rallied just beyond the Fibonacci 23% retrace level. This could be my first wave up. When this wave ends, I expect a leg down in a wave 2 and then a new rally leg in what could be a wave 3.
Third waves are identifiable by their long and strong nature with momentum readings very high. If I see that, then I know I have a likely third wave operating.
I am therefore on the lookout for a dip from around current levels, then a renewed rally. If that rally is long and strong, it would enable me to call it a third wave, which could reach the Fibonacci 62% level at the $1,290 area.
And with bullish sentiment still at record low levels, the potential is high for the bears to be given a shock. This is because the market is very short', meaning that speculators on Comex increased their shorts by a whopping factor of four since October. This is setting up the potential for a large short squeeze.
We are a few days past the celebrations of the New Year, but the fireworks are getting even more spectacular!
Get the latest financial news, insights and expert analysis from our award-winning MoneyWeek team, to help you understand what really matters when it comes to your finances.
John is is a British-born lapsed PhD physicist, who previously worked for Nasa on the Mars exploration team. He is a former commodity trading advisor with the US Commodities Futures Trading Commission, and worked in a boutique futures house in California in the 1980s.
He was a partner in one of the first futures newsletter advisory services, based in Washington DC, specialising in pork bellies and currencies. John is primarily a chart-reading trader, having cut his trading teeth in the days before PCs.
As well as his work in the financial world, he has launched, run and sold several 'real' businesses producing 'real' products.
-
 Average UK house price reaches £300,000 for first time, Halifax says
While the average house price has topped £300k, regional disparities still remain, Halifax finds.
-
 Barings Emerging Europe trust bounces back from Russia woes
Barings Emerging Europe trust has added the Middle East and Africa to its mandate, delivering a strong recovery, says Max King