The price of gold is in rally mode in the charts
As the counter-trend rally in gold has shown, Elliot wave theory is indispensable in finding turns in the market, says John C Burford.
Get the latest financial news, insights and expert analysis from our award-winning MoneyWeek team, to help you understand what really matters when it comes to your finances.
You are now subscribed
Your newsletter sign-up was successful
Want to add more newsletters?

Twice daily
MoneyWeek
Get the latest financial news, insights and expert analysis from our award-winning MoneyWeek team, to help you understand what really matters when it comes to your finances.

Four times a week
Look After My Bills
Sign up to our free money-saving newsletter, filled with the latest news and expert advice to help you find the best tips and deals for managing your bills. Start saving today!
In Friday's post, I suggested that gold was poised for a counter-trend rally. One of the main clues was the five-wave count of the wave down from the October 30 high.
When we see a clear five-wave pattern, we should always expect a counter-trend move. That is one of the basic rules of EWT (Elliot wave theory).
The strength of this counter-trend move depends on the context in which the five-wave pattern sits. Let me explain.
MoneyWeek
Subscribe to MoneyWeek today and get your first six magazine issues absolutely FREE

Sign up to Money Morning
Don't miss the latest investment and personal finances news, market analysis, plus money-saving tips with our free twice-daily newsletter
Don't miss the latest investment and personal finances news, market analysis, plus money-saving tips with our free twice-daily newsletter
What to look for in the coming days
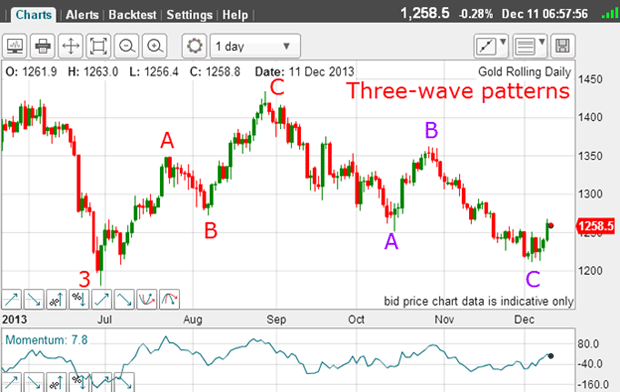
The crucial point here is that the pattern is also in three waves (purple A-B-C). And wave C terminated at the Fibonacci 78% retrace of the A-B-C wave, up from the wave 3 low. This means that with this purple A-B-C, the decline is not likely to resume just yet (A-B-Cs are counter to the one larger trend).
Let me put this into context: if this interpretation is correct (and we do not get a sudden move down to make a large five-wave pattern), then the five-wave nature of the purple C wave means that this C wave has most likely come to an end.
From here, the market has two main rally options. It could rally in another A-B-C to a Fibonacci retrace of the C wave, and then decline. Alternatively, it could rally in a small-scale five-wave motive pattern.
The telltale sign for this interpretation is to see a long and strong third wave up on the hourly chart. And that is what I will be looking for in the days ahead.
A third wave in the making
Note that EWT can give you these possible forecasts. In fact, I can think of no other model that can do this in such a clear way. And by using the Fibonacci levels alongside your tramlines, you can set your price targets with confidence.
This was the picture on Friday:
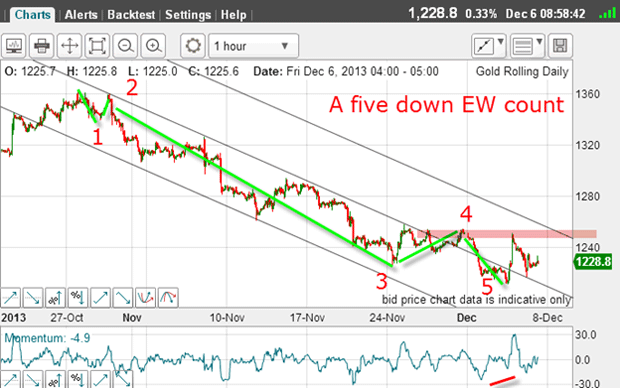
If I had found the low for my purple C wave at the red wave 5 low, then the market should rally to challenge the area of the pink bar. This is what I wrote on Friday: "The key for a decent rally is the pink area of resistance lurking at the previous highs. That is where an awful lot of buy stops will be lurking, having been placed there by the huge army of shorts who dominate the market."
Was there an abundance of buy stops there?
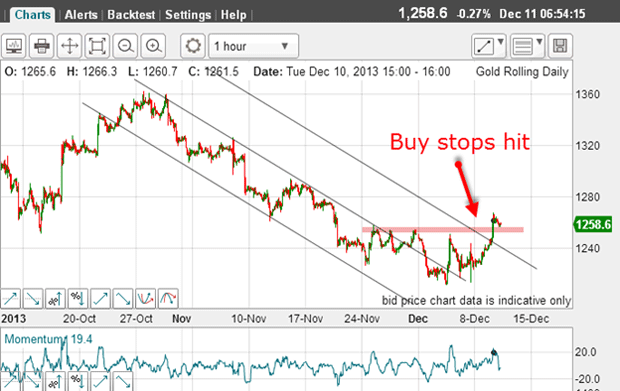
With a $25 rally yesterday into my pink zone, I would answer yes.
Not only that, but the strong nature of yesterday's rally is very suggestive of a third wave in the making. Let's see if I can apply some tentative EW labels to this rally:
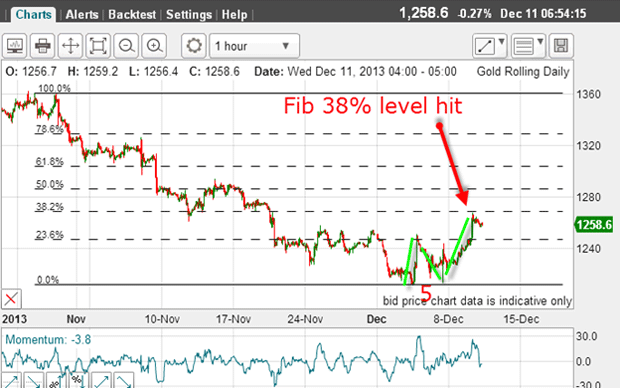
With my significant low in place (wave 5), I can also apply my Fibonacci tool to the wave down off the 30 October high. And right away, I see the rally has stopped/paused at the 38% level. Isn't that pretty?
Off the wave 5 low, I can see a rally in wave 1, then a decline to wave 2. This wave 2 does not exceed the low of wave 5, and thereby obeys the EW rules. This wave 2 occurred later on Friday, when the US unemployment data was released. That sent many markets into a spin with feverish volatility.
Nevertheless, my wave 5 low did hold, thus demonstrating the strong support at this level. That was another clue that the path of least resistance was now up.
Finding new tramlines
With the new minor highs and lows in place, can I find new tramlines?
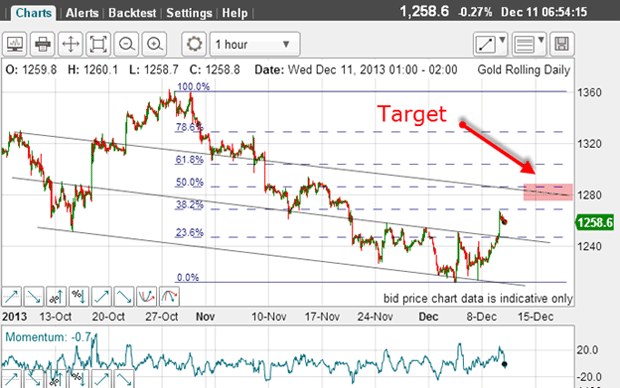
The highs made in the past two weeks have given me a superb centre tramline. Note the lovely PPPs (prior pivot points) on all three tramlines. This is about as good as it gets for tramline analysis, especially in the tricky gold chart.
With the centre tramline break yesterday, I now have a new target at my upper tramline, which is close to the Fibonacci 50% retrace, and is a common target for reversals. The 62% level is another common target and that lies in the $1,300 area a juicy $60 - $70 above a possible long entry last week.
But with only three waves up so far, the other option is that this is only an A-B-C and the next move is down.
This could be a major run
| (Contracts of 100 troy ounces) | Row 0 - Cell 1 | Row 0 - Cell 2 | Row 0 - Cell 3 | Open interest: 386,436 | ||||
| Commitments | ||||||||
| 134,546 | 111,855 | 24,091 | 190,092 | 212,391 | 348,729 | 348,337 | 37,707 | 38,099 |
| Changes from 11/26/13 (Change in open interest: -7,996) | ||||||||
| 1,132 | 4,996 | -2,955 | -5,919 | -11,856 | -7,742 | -9,815 | -254 | 1,819 |
| Percent of open interest for each category of traders | ||||||||
| 34.8 | 28.9 | 6.2 | 49.2 | 55.0 | 90.2 | 90.1 | 9.8 | 9.9 |
| Number of traders in each category (Total traders: 265) | ||||||||
| 94 | 85 | 65 | 57 | 53 | 185 | 178 | Row 8 - Cell 7 | Row 8 - Cell 8 |
In the last week, the hedge funds (non-commercials) swung even more to the bearish camp, as did the small trader (non-reportables). Note that the trade (commercials) lifted a chunk of their short positions, as they became less bearish.
We know that hedge funds, who dominate the Comex futures market, are primarily trend followers and generally increase their short positions as the market declines (the momentum method). But at turns they are caught flat-footed, and their enforced short covering often leads to major rallies.
This is the very best time to trade against the hedgies and can give you major wins if your timing is correct.
Get the latest financial news, insights and expert analysis from our award-winning MoneyWeek team, to help you understand what really matters when it comes to your finances.
John is is a British-born lapsed PhD physicist, who previously worked for Nasa on the Mars exploration team. He is a former commodity trading advisor with the US Commodities Futures Trading Commission, and worked in a boutique futures house in California in the 1980s.
He was a partner in one of the first futures newsletter advisory services, based in Washington DC, specialising in pork bellies and currencies. John is primarily a chart-reading trader, having cut his trading teeth in the days before PCs.
As well as his work in the financial world, he has launched, run and sold several 'real' businesses producing 'real' products.
-
 Average UK house price reaches £300,000 for first time, Halifax says
While the average house price has topped £300k, regional disparities still remain, Halifax finds.
-
 Barings Emerging Europe trust bounces back from Russia woes
Barings Emerging Europe trust has added the Middle East and Africa to its mandate, delivering a strong recovery, says Max King