My reliable Dow setup led to a perfect trade
John C Burford reveals how the Dow Jones gifted swing traders a highly reliable trading opportunity.
Get the latest financial news, insights and expert analysis from our award-winning MoneyWeek team, to help you understand what really matters when it comes to your finances.
You are now subscribed
Your newsletter sign-up was successful
Want to add more newsletters?

Twice daily
MoneyWeek
Get the latest financial news, insights and expert analysis from our award-winning MoneyWeek team, to help you understand what really matters when it comes to your finances.

Four times a week
Look After My Bills
Sign up to our free money-saving newsletter, filled with the latest news and expert advice to help you find the best tips and deals for managing your bills. Start saving today!
Last Monday, I covered a very interesting set-up in the Dow. In fact, the hourly chart displayed one of my all-time favourite patterns the 'five/three'.
I mentioned in my coverage of GBP/USD on Friday that the chart there also was displaying a five/three, and that there were several more current examples in different markets. So today, I want to show that the Dow set-up last week was a highly reliable trading opportunity.
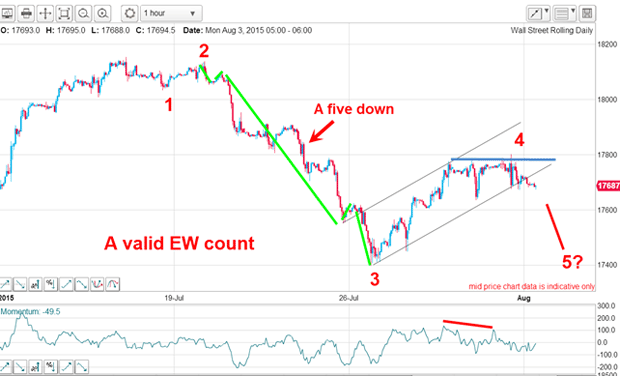
Below is the Dow chart I posted last Monday:
MoneyWeek
Subscribe to MoneyWeek today and get your first six magazine issues absolutely FREE

Sign up to Money Morning
Don't miss the latest investment and personal finances news, market analysis, plus money-saving tips with our free twice-daily newsletter
Don't miss the latest investment and personal finances news, market analysis, plus money-saving tips with our free twice-daily newsletter

The in-progress five down pattern off the mid-July high was a very clear impulsive move and by that, I mean the third wave was long and strong, producing very low momentum readings along its length. That is the signature of a third wave and allows you to conclude the main trend is now down and in alignment with the third wave.
Incidentally, another feature of most third waves is that counter-trend moves are usually very small and brief and this one certainly fits the bill.
According to Elliott wave theory, any rally following a third wave is very likely to be counter-trend and will usually be in a three-wave form of some description. And that is indeed what the market produced last week. The counter-trend rally had managed a Fibonacci 50% retrace of the move down a typical turning point. That was my wave 4 high and an ideal place to enter a short trade.
In addition, this rally was contained within the trading channel of my tramline pair, and when the rally had completed, there was a clear momentum divergence going into this high a vital clue that the rally was likely over. The main downtrend could then resume.
I forecast the Dow low two weeks ago
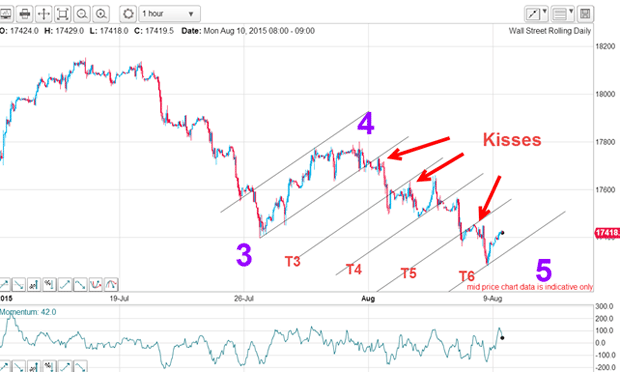
Soon after I posted last Monday's chart, the market did indeed begin its descent and rapidly made it to T3 in a scalded-cat bounce. But it didn't stop there just admire all of the hits and kisses on the tramlines I have drawn parallel and equidistant from the first pair. In fact on Friday, the market made an accurate hit and bounce on T6 which was in new low ground and did enough to say that wave 5 could be in.

So now I have a likely complete five down, as I had forecast at least two weeks ago. That is the power of using simple Elliott wave concepts, combined with my tramline and Fibonacci principles. In fact, this is a textbook example of how to use my methods in real time.
With the Dow having made this new low on Friday, can we really say that wave 5 has actually ended? If we can, then the next move will likely be a counter-trend rally.
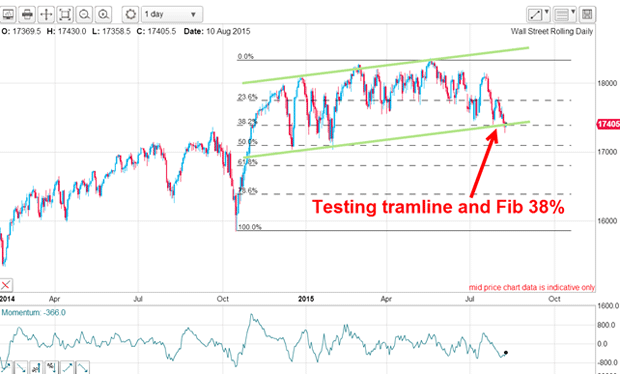
This is the time to step back and look at the daily chart to see how all this fits into the bigger picture. I have drawn in my green tramlines that I have been working on for some time. Currently, the market has declined to test the lower tramline support, which is also the Fibonacci 38% support level. That implies there is a great deal of support near current levels and adds weight to the conclusion that wave 5 has indeed very likely terminated.

That implies the counter-trend rally should be starting from around current levels. In any case, at least a profit of around 400 pips on the shorts taken at the wave 4 high could be banked a very satisfactory trade.
Get the latest financial news, insights and expert analysis from our award-winning MoneyWeek team, to help you understand what really matters when it comes to your finances.
John is is a British-born lapsed PhD physicist, who previously worked for Nasa on the Mars exploration team. He is a former commodity trading advisor with the US Commodities Futures Trading Commission, and worked in a boutique futures house in California in the 1980s.
He was a partner in one of the first futures newsletter advisory services, based in Washington DC, specialising in pork bellies and currencies. John is primarily a chart-reading trader, having cut his trading teeth in the days before PCs.
As well as his work in the financial world, he has launched, run and sold several 'real' businesses producing 'real' products.
-
 Barings Emerging Europe trust bounces back from Russia woes
Barings Emerging Europe trust has added the Middle East and Africa to its mandate, delivering a strong recovery, says Max King
-
 How a dovish Federal Reserve could affect you
Trump’s pick for the US Federal Reserve is not so much of a yes-man as his rival, but interest rates will still come down quickly, says Cris Sholto Heaton