How to trade a fast-moving market
The pound versus dollar market is giving a text book example of how to use chart-trading methods, says John C Burford.
Get the latest financial news, insights and expert analysis from our award-winning MoneyWeek team, to help you understand what really matters when it comes to your finances.
You are now subscribed
Your newsletter sign-up was successful
Want to add more newsletters?

Twice daily
MoneyWeek
Get the latest financial news, insights and expert analysis from our award-winning MoneyWeek team, to help you understand what really matters when it comes to your finances.

Four times a week
Look After My Bills
Sign up to our free money-saving newsletter, filled with the latest news and expert advice to help you find the best tips and deals for managing your bills. Start saving today!
As many of my readers know, I have a few favourite trade set-ups that I illustrate from time to time using current charts. One of these is the five up/three down (or three/down five up). And that pattern is running on cable (GBP/USD) at the moment.
Perhaps I should call it the 'five/three' from here. The two numbers refer a particular wave pattern that is clearly recognisable even when the pattern is in progress. Of course, it is of no use to a trader to see the pattern after it has completed there is no profit in doing that. But at various points during the pattern, there are several clues as to where to enter trades. You can anticipate the outcome with high accuracy and what trader would not want to have this information?
A perfect five/three' in the GBP/USD
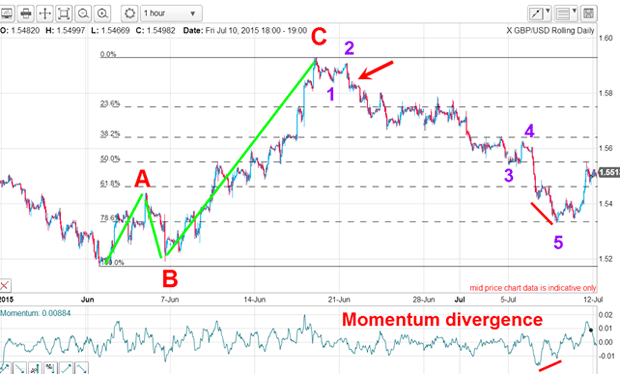
I have found that extended C waves are quite common in the currencies. As a side point, it's worth noting that currency markets often travel farther than most expect. Certainly, the long-term trends in currencies can last many months and even years.
MoneyWeek
Subscribe to MoneyWeek today and get your first six magazine issues absolutely FREE

Sign up to Money Morning
Don't miss the latest investment and personal finances news, market analysis, plus money-saving tips with our free twice-daily newsletter
Don't miss the latest investment and personal finances news, market analysis, plus money-saving tips with our free twice-daily newsletter
So, after the rally of over nine cents off the low, the market started to reverse and made a 'V' shape top. I use this small pattern to position trade entries. Here it is in close-up:
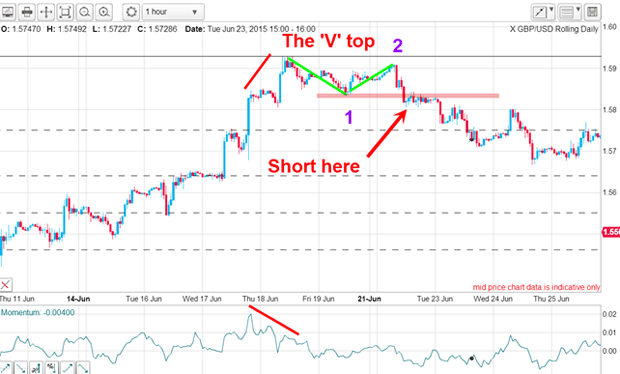
As the C wave was ending, there was a large momentum divergence at the high. That was a clear warning to expect a change of trend.
Wave 1 down was the apex of the 'V'. When the market rallied in wave 2 and then declined to break that apex (pink bar), it was a sign that the top was very likely in. That was my cue to take a short trade.
Because there was a very large momentum divergence, you could expect a very sharp move down. Remember, the larger the divergence the sharper the reversal. I use this as an early-warning signal to expect a third wave.
Sure enough, the decline in wave 3 was severe. But note where it landed on the precise Fibonacci 78% retrace of the entire A-B-C rally. What's more, there was a momentum divergence there, offering a clue that profits could be taken and to expect an upward reversal.
What's next for GBP/USD?
So where was the second trade entry? Why, at the inverse 'V' at the start of the A wave where you would go long!
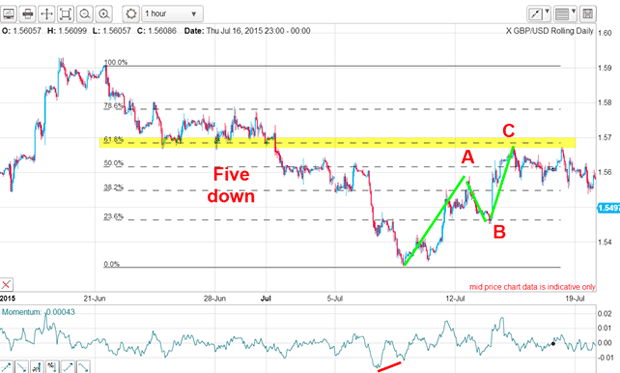
What would you expect after a five down? Of course, a three up. Not only that, but the most likely target for the C wave top would be a Fibonacci 50% or 62% retrace. Those are the levels most commonly found as turning points.
As you can see, that is precisely what occurred. That C wave high was the signal to take your profit. So now we have two profitable completed trades of at least 600 pips in total, or £6,000 for every £1 spread bet.
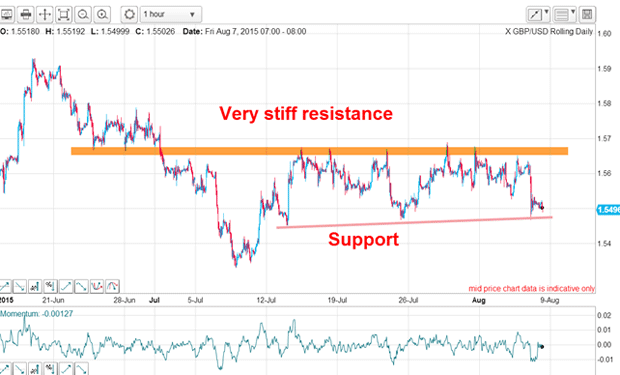
Now what do we expect? A decline off the C wave high aligning the market with the one larger down trend is most common in this setup. But Mr Market didn't go down without a fight!
For the past three weeks, the market has been trapped within a band with the upper bound the Fibonacci 62% level being tested many times. Each time, that resistance has held firm.
Yesterday, the market fell away from that line yet again and is now testing the lower line of support. If my 5/3 scenario is still valid, I expect a break of that support at some stage. That is because the five down is the clue that the main trend remains down and the three up was a counter-trend rally.
There are several examples of the 5/3 pattern in current markets. Here, for example, is one on the Dax:
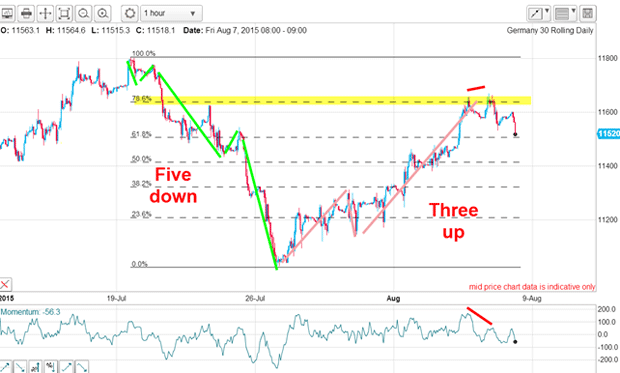
I have a five down and a three up with a large momentum divergence at the C wave high. There were similar trade entries as in the previous GBP/USD example.
So, where do you think this one will go next?
Get the latest financial news, insights and expert analysis from our award-winning MoneyWeek team, to help you understand what really matters when it comes to your finances.
John is is a British-born lapsed PhD physicist, who previously worked for Nasa on the Mars exploration team. He is a former commodity trading advisor with the US Commodities Futures Trading Commission, and worked in a boutique futures house in California in the 1980s.
He was a partner in one of the first futures newsletter advisory services, based in Washington DC, specialising in pork bellies and currencies. John is primarily a chart-reading trader, having cut his trading teeth in the days before PCs.
As well as his work in the financial world, he has launched, run and sold several 'real' businesses producing 'real' products.
-
 Average UK house price reaches £300,000 for first time, Halifax says
While the average house price has topped £300k, regional disparities still remain, Halifax finds.
-
 Barings Emerging Europe trust bounces back from Russia woes
Barings Emerging Europe trust has added the Middle East and Africa to its mandate, delivering a strong recovery, says Max King