Studying sentiment will always give you an edge
John C Burford explains how gauging investor sentiment can help you time your trade entries and exits.
Get the latest financial news, insights and expert analysis from our award-winning MoneyWeek team, to help you understand what really matters when it comes to your finances.
You are now subscribed
Your newsletter sign-up was successful
Want to add more newsletters?

Twice daily
MoneyWeek
Get the latest financial news, insights and expert analysis from our award-winning MoneyWeek team, to help you understand what really matters when it comes to your finances.

Four times a week
Look After My Bills
Sign up to our free money-saving newsletter, filled with the latest news and expert advice to help you find the best tips and deals for managing your bills. Start saving today!
Recently, I came across a wonderful quote in an investment book that encapsulates the attitude of a trader, rather than that of an investor. A trader must use some degree of intuition to pre-empt the number-crunching of the investment analysts:"Some of us are here today because one of our ancestors started running when the birds stopped singing, instead of waiting until he could count the precise number of Viking invaders."
What a wonderful indictment of the overthinking that so often masquerades as insightful analysis.
An investor will spend a great deal of time and effort with the numbers to try to figure out if a particular investment is undervalued and if so, by how much. But what is usually missing from such analysis is a consideration of the state of market sentiment. In a rapidly falling market where sentiment is deteriorating, previously 'undervalued' shares can become even more under-valued, as was discovered in 20072009.
MoneyWeek
Subscribe to MoneyWeek today and get your first six magazine issues absolutely FREE

Sign up to Money Morning
Don't miss the latest investment and personal finances news, market analysis, plus money-saving tips with our free twice-daily newsletter
Don't miss the latest investment and personal finances news, market analysis, plus money-saving tips with our free twice-daily newsletter
I have long maintained that traders and investors alike could improve the timing of their entries (and crucially, exits) if they studied the impact sentiment has on the markets.
Nothing's more important than sentiment just look at China
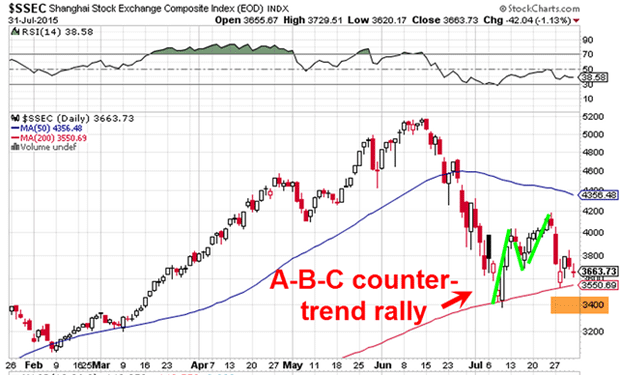
One vivid example of this is being displayed by the Chinese stock market, which I have quoted in recent emails. The much-publicised collapse by around 35% in the Shanghai Index to the July 9 low has filled some traders with panic. But it was met by a relief rally in a typical A-B-C counter-trend form:

Three other decisions made by the authorities were also well-publicised: the decision to ban short selling, the decision to ban large accounts from selling and the decision to halt trading in more than 1,400 issues. Oh, and the decision to assemble a big bazooka fund of $480bn to buy shares on margin.
I guess a communist government can do that and get away with it. But will it turn fearful traders into hopeful ones?
My point is that the rally has, according to reports, encouraged some traders/gamblers to try to regain their losses by 'buying the dip' in imitation of their US counterparts in the hedge fund sector. That latter strategy has been wildly successful at least it was up to end-2014.
But are the Chinese authorities, with their extreme market-propping activities, pushing on a string? Is the overwhelming appetite to gamble in the Shanghai casino on the wane?
The sentiment picture is just as unclear in the West
But are Western stockmarkets as confused as the Shanghai Composite?
Let's examine a couple of key technical straws in the wind.
Exhibit A: NYSE advance/decline is falling rapidly
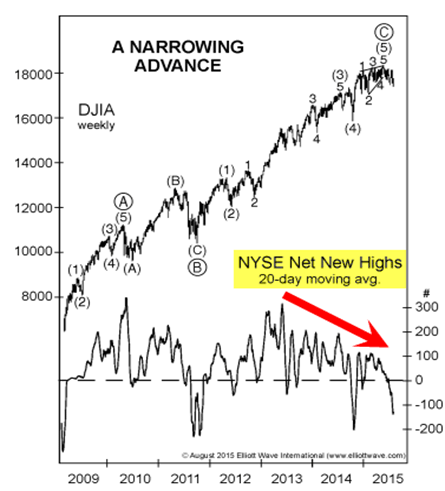
The advance/decline figure reached its high in early-2013 when the Dow was trading around the 14,000 area and since then, the advance/decline line has been falling hard while the Dow has advanced by around 30%.

(chart courtesy www.elliottwave.com)
The Dow made its high on May 19 at the 18,360 level (currently 17,700) when the advance/decline line was dropping through the zero line (equal number of advances and declines). But since then, the number of advances has dropped sharply, while the index has remained elevated. This shows that the rally army is being led by fewer and fewer generals. That is unhealthy and shows that risk is being taken off the table. Only a dwindling number of issues are keeping the index aloft.
Exhibit B: short-term interest rates are on the rise

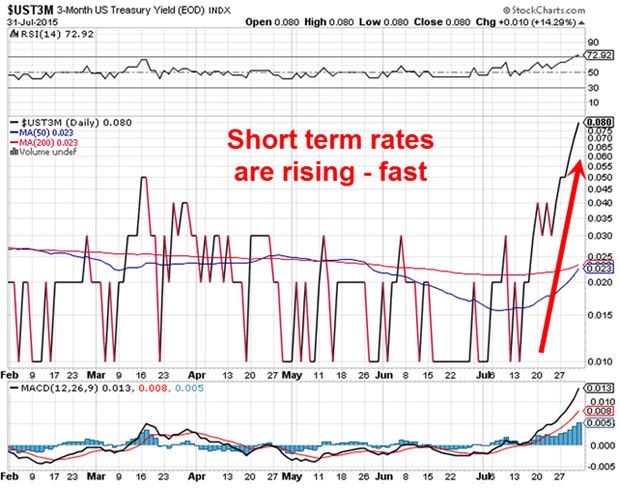
This rate is for the most common ultra-safe T-bill offered by the US Treasury. It is a relatively open market with honest price discovery (that is, not manipulated by the Fed) and from a sleep-inducing range over the past few months, the yield has suddenly shot up from 0.010% to the recent 0.080% a massive gain of 800% within two or three weeks! That's what I call a bull market breakout in yield.
Many factors could be involved here, but one thing is clear: it lends support to the US dollar and is potentially bearish for assets including equities, because it is showing risk is being taken out of the system and funds are being sent into safer areas.
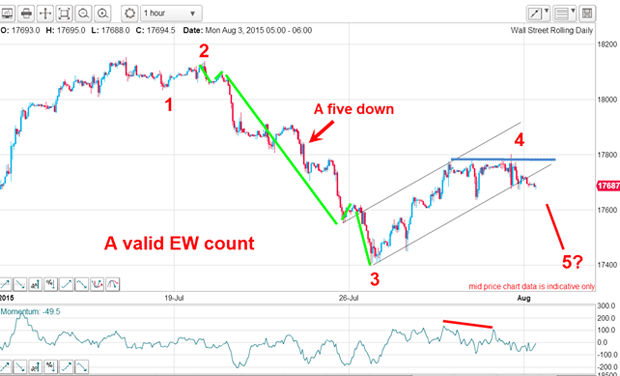
But are there signs of a turnaround in the Dow? I have a valid Elliott wave count and the market last week rallied to the Fibonacci 50% level in wave 4.
Here is the updated hourly chart:

This rally, which can be seen as an A-B-C with a momentum divergence, has moved within the trading channel of my tramlines with the lower line being breached overnight. Hmm...
Get the latest financial news, insights and expert analysis from our award-winning MoneyWeek team, to help you understand what really matters when it comes to your finances.
John is is a British-born lapsed PhD physicist, who previously worked for Nasa on the Mars exploration team. He is a former commodity trading advisor with the US Commodities Futures Trading Commission, and worked in a boutique futures house in California in the 1980s.
He was a partner in one of the first futures newsletter advisory services, based in Washington DC, specialising in pork bellies and currencies. John is primarily a chart-reading trader, having cut his trading teeth in the days before PCs.
As well as his work in the financial world, he has launched, run and sold several 'real' businesses producing 'real' products.
-
 Can mining stocks deliver golden gains?
With gold and silver prices having outperformed the stock markets last year, mining stocks can be an effective, if volatile, means of gaining exposure
-
 8 ways the ‘sandwich generation’ can protect wealth
People squeezed between caring for ageing parents and adult children or younger grandchildren – known as the ‘sandwich generation’ – are at risk of neglecting their own financial planning. Here’s how to protect yourself and your loved ones’ wealth.