My new Aussie trade springs a surprise
Basic Elliott wave theory alone can alert you to a major trend change in the charts, says John C Burford.
Get the latest financial news, insights and expert analysis from our award-winning MoneyWeek team, to help you understand what really matters when it comes to your finances.
You are now subscribed
Your newsletter sign-up was successful
Want to add more newsletters?

Twice daily
MoneyWeek
Get the latest financial news, insights and expert analysis from our award-winning MoneyWeek team, to help you understand what really matters when it comes to your finances.

Four times a week
Look After My Bills
Sign up to our free money-saving newsletter, filled with the latest news and expert advice to help you find the best tips and deals for managing your bills. Start saving today!
Today, I thought I would follow up on my maiden coverage of an important forex market AUD/JPY. In my post of 23 June, I explained how I analyse a new market as I pass from the long-term multi-year chart to the hourly. I concluded that the market's trend was likely about to change.
Since then, the market has thrown up a surprise, so I want to show how you can probe for a major trend change at low risk.
Along the way, I picked up clues as to the character of the market, and its current position in the context of the past. I recommend you read that post again.
MoneyWeek
Subscribe to MoneyWeek today and get your first six magazine issues absolutely FREE

Sign up to Money Morning
Don't miss the latest investment and personal finances news, market analysis, plus money-saving tips with our free twice-daily newsletter
Don't miss the latest investment and personal finances news, market analysis, plus money-saving tips with our free twice-daily newsletter
It is vital that you put the current market position in its context in order to make sensible trades. For instance, if you have determined that the market is in a fifth wave up, you would be well advised not to look to trade long with the trend even on a dip to a Fibonacci level.
That is why I always recommend you keep the larger context in mind at all times.
In that post, I laid out my reasons why I suspected a major top was approaching.
It is a vivid lesson in how, by using only basic Elliott wave (EW) theory, you can make highly accurate forecasts for a major trend change.
And isn't this what every trader (or investor) would dearly love to be able to do?
The most disastrous state of mind for a swing trader
It is a sad fact that most traders/investors do not take their profits at major trend changes. I have written about how most people become more and more bullish as the market rises and are therefore mentally unprepared to exit their cherished position at the best time near a top. They are reluctant to leave the party when at its height a system one decision!
Then, a state of denial quickly overcomes them as the market turns down. This is a disastrous state of mind for a swing trader.
Of course, the armchair experts' are always telling you that it is impossible to time your entries and exits and the best policy is to buy and hold. In swing trading, nothing could be further from the truth.
Swing traders have to know when to let go
In swing trading, it is essential to know when the trend has changed to a high degree of accuracy. Hanging on too long can mean a large give-up of profit or even a loss. Doing that can be emotionally devastating.
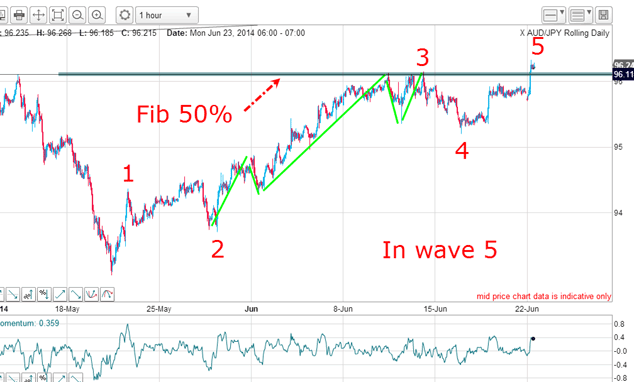
In my AUD/JPY trade, the last piece of evidence for an approaching trend change was my EW count on the hourly:

On 23 June, the market had carved out a convincing impulsive five-wave pattern and the final fifth wave was in progress. It seemed clear that when this fifth wave ended, the top would be in and the new down trend would emerge.
What to do when the market serves up a surprise
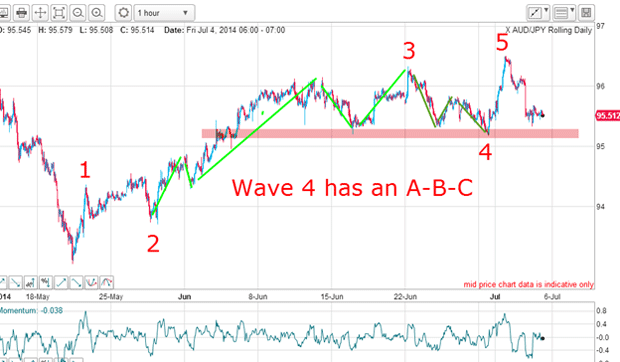
And a small surprise is just what the market served up. Here is the updated chart:

My old wave 5 certainly did top out on 23 June and the market promptly fell to the pink support zone, which occurred on a very clear A-B-C (as marked). The market then rallied to a new high, which meant that I had to void my original count.
The decline in my new wave 4 in three waves was a very clear indication that the rally was not yet over. Three waves are counter-trend. Now, this new count has a slightly better 'look' than before with the new wave 3 containing its own long and strong third sub-wave.
But now, I could easily shift the labels as shown and start to look for a top in the 96.50 area. Recall, this was still in the vicinity of the Fibonacci 50% retrace marked on the top chart, and a reason to suspect a rally top here.
Now, the market is declining to test the pink support zone again and a break there would be bearish.
Why you should ignore the experts'
The important point is that even though my original count was incorrect, the trade would not be a loser. That is vitally important.
But now my new short trade near the new wave 5 high is in profit and I can move my protective stop to break-even. This is the ideal stress-free position to be in.
We are always advised by those armchair experts' not to try to pick tops (or bottoms), but when your method is sound, it is the rational, profit-seeking, loss-avoiding choice of your system two mind. Go for it!
Get the latest financial news, insights and expert analysis from our award-winning MoneyWeek team, to help you understand what really matters when it comes to your finances.
John is is a British-born lapsed PhD physicist, who previously worked for Nasa on the Mars exploration team. He is a former commodity trading advisor with the US Commodities Futures Trading Commission, and worked in a boutique futures house in California in the 1980s.
He was a partner in one of the first futures newsletter advisory services, based in Washington DC, specialising in pork bellies and currencies. John is primarily a chart-reading trader, having cut his trading teeth in the days before PCs.
As well as his work in the financial world, he has launched, run and sold several 'real' businesses producing 'real' products.
-
 MoneyWeek Talks: The funds to choose in 2026
Podcast Fidelity's Tom Stevenson reveals his top three funds for 2026 for your ISA or self-invested personal pension
-
 Three companies with deep economic moats to buy now
Opinion An economic moat can underpin a company's future returns. Here, Imran Sattar, portfolio manager at Edinburgh Investment Trust, selects three stocks to buy now