How to trade in a brand new market
John C Burford looks to profit from the Aussie dollar against the yen, and explains what he looks for when he's trading any new market.
Get the latest financial news, insights and expert analysis from our award-winning MoneyWeek team, to help you understand what really matters when it comes to your finances.
You are now subscribed
Your newsletter sign-up was successful
Want to add more newsletters?

Twice daily
MoneyWeek
Get the latest financial news, insights and expert analysis from our award-winning MoneyWeek team, to help you understand what really matters when it comes to your finances.

Four times a week
Look After My Bills
Sign up to our free money-saving newsletter, filled with the latest news and expert advice to help you find the best tips and deals for managing your bills. Start saving today!
This morning I will veer off the exciting gold story I have been covering recently and show how I approach a brand new market and the analytical steps I take to judge whether there is a trade on or not. There is a multitude of currency crosses that we can explore. Although I like to concentrate on my favourites EUR/USD, GBP/USD and USD/JPY most of the time, I will look at others at various times.
Almost at random, I have chosen the AUD/JPY cross. This is a very popular market with the Aussie dollar very much a commodity-heavy currency, while the Japanese yen is a commodity-free currency.
Australia's main exports are the various mineral commodities that are snapped up by China, its main customer. Japan imports virtually all of the raw materials it needs, so it is on the other side of the global commodity trade.
MoneyWeek
Subscribe to MoneyWeek today and get your first six magazine issues absolutely FREE

Sign up to Money Morning
Don't miss the latest investment and personal finances news, market analysis, plus money-saving tips with our free twice-daily newsletter
Don't miss the latest investment and personal finances news, market analysis, plus money-saving tips with our free twice-daily newsletter
In other words, the interests of Australia are the opposite of Japan's and the currency cross reflects this dynamic.
What I look for in a new market
Trade for Profit Academy.
My first step is to look at the monthly (or weekly) chart going back several years to check on its history and any major trends that may be operating. The same information appears in both, but sometimes the waves stand out better in one rather than the other. Of course, it is the same for the daily chart.
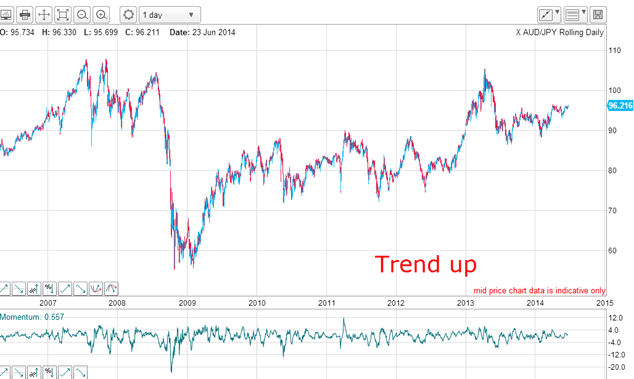
The first thing to notice is that this is a widely swinging market with plenty of highly profitable swings provided we can catch them. The huge wipe-out from the 108 highs in 2008 resulted in lows in the 55 area a massive decline of 50% and from there, the market has been in a clear uptrend with a succession of higher highs and higher lows.
The trend since 2009 has been up. The question is: is this uptrend a true bull market, or is it a relief rally in a bear market?
Proof that markets have memories
In terms of the Elliott wave patterns,there are some stand-out labels I can apply:
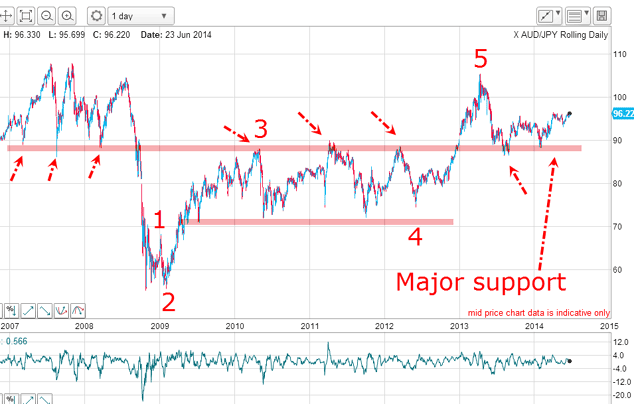
I have five clear impulse waves up off the 2009 low, which implies the rally phase is probably over because fifth waves are ending waves.
Also noteworthy is the solid zone of support/resistance(the upper pink bar), which has been in operation for at least seven years. This is a remarkable demonstration of the power of chart support/resistance zones and proves that markets have memories. Whenever the market has approached this zone, either from above or below, there was a great bounce trade on except for the two occasions where the market burst through this zone with force.
My conclusion so far: the main trend is up, but that trend may have ended at the 105 high.
Time to zoom in on the latest action off this high and search for tramlines:
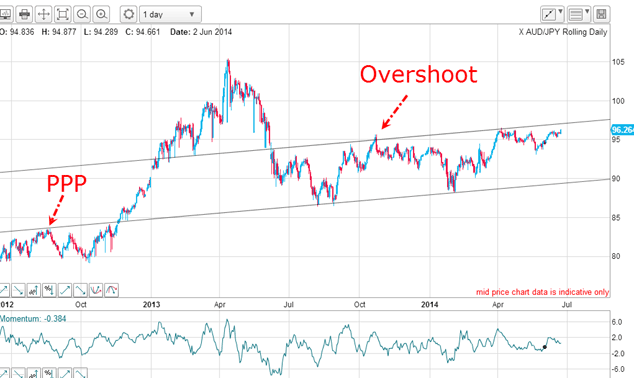
And here they are and they are excellent with a solid prior pivot point (PPP)on the lower line, which has three accurate touch points. The upper line also has a good PPP, an overshoot and passes through the major gap of June 2013. The market is currently challenging the upper tramline, which is a line of resistance.
What else the chart is telling us
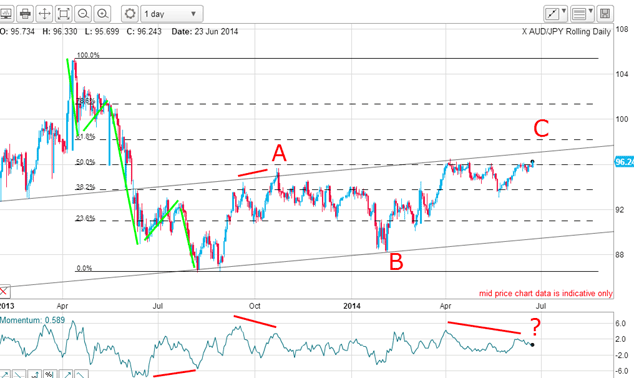
The move off the 105 high is a clear five-wave impulsive pattern with a lovely positive momentum divergencebetween the third and fifth waves. This is pure textbook.
And from the August 2013 low, I can count a clear A-B-C pattern within my tramlines, with the market currently finishing off the C wave. Note the momentum divergences along the way, which gave warnings of upcoming trend changes. This is vital information, because five down and three up means one thing the main trend is down.
I have also drawn in the Fibonaccilevels for the five-wave down move. Since April, the market has been testing the 50% level, which is a typical turning point for relief rallies. If the market does turn here or hereabouts, there will be a nice negative momentum divergence to point the way to lower prices.
Is the market heading towards a major top?
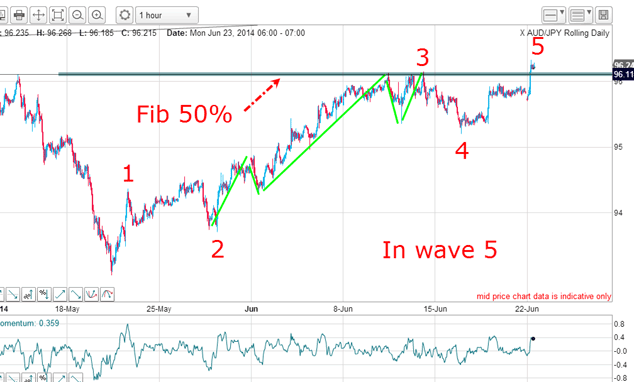
I have a clear five-wave impulsive count off the May low with the third wave sporting its own five-wave mini waves (and that mini third wave also contains five sub-sub-waves).
This morning, the market has poked above wave 3 and the Fibonacci 50% level in a new wave 5. This wave 5 also has five sub-waves! Aren't these Elliott waves pretty?
When this wave 5 ends, that will be my C wave high.
How do I size up the situation this morning? The market has been in a long-term uptrend off the 2009 lows, but that trend looks like it ended at the 105 high, and we have a new major downtrend in operation.
I am now looking for signs of a major near-term top.
Get the latest financial news, insights and expert analysis from our award-winning MoneyWeek team, to help you understand what really matters when it comes to your finances.
John is is a British-born lapsed PhD physicist, who previously worked for Nasa on the Mars exploration team. He is a former commodity trading advisor with the US Commodities Futures Trading Commission, and worked in a boutique futures house in California in the 1980s.
He was a partner in one of the first futures newsletter advisory services, based in Washington DC, specialising in pork bellies and currencies. John is primarily a chart-reading trader, having cut his trading teeth in the days before PCs.
As well as his work in the financial world, he has launched, run and sold several 'real' businesses producing 'real' products.
-
 Average UK house price reaches £300,000 for first time, Halifax says
While the average house price has topped £300k, regional disparities still remain, Halifax finds.
-
 Barings Emerging Europe trust bounces back from Russia woes
Barings Emerging Europe trust has added the Middle East and Africa to its mandate, delivering a strong recovery, says Max King