Gold is heading for a major target
The gold market is approaching an interesting juncture, says spread betting expert John C Burford. Here, he looks at how to play it.
Get the latest financial news, insights and expert analysis from our award-winning MoneyWeek team, to help you understand what really matters when it comes to your finances.
You are now subscribed
Your newsletter sign-up was successful
Want to add more newsletters?

Twice daily
MoneyWeek
Get the latest financial news, insights and expert analysis from our award-winning MoneyWeek team, to help you understand what really matters when it comes to your finances.

Four times a week
Look After My Bills
Sign up to our free money-saving newsletter, filled with the latest news and expert advice to help you find the best tips and deals for managing your bills. Start saving today!
On Wednesday, I noted that the gold market was approaching an interesting juncture. I had taken nice profits on the down move from the late May break, and then on the up move to the $1,280 level reached on Monday.
But was there any more upside to this move? After all, I had forecast a major rally at some stage. I felt the resistanceat my long-term tramlinewas key. If that gave way, we would very likely see this major move up.
But this presented a problem: where was the best placement for this tramline? I have a particular challenge with tramline placement with the gold market because of the infamous spikes that show up in the many pigtails on the candlesticks.
MoneyWeek
Subscribe to MoneyWeek today and get your first six magazine issues absolutely FREE

Sign up to Money Morning
Don't miss the latest investment and personal finances news, market analysis, plus money-saving tips with our free twice-daily newsletter
Don't miss the latest investment and personal finances news, market analysis, plus money-saving tips with our free twice-daily newsletter
How to place tramlines in the tricky gold market
It is not uncommon to be able to set equally good tramlines which are $10 or more apart at the right hand edge and, for a swing trade, a difference of this magnitude could spell the difference between a low-risk entry and a high-risk one.
In fact, in my Trade for Profit Academy, I give several tips on how to find the best tramlines in any situation.
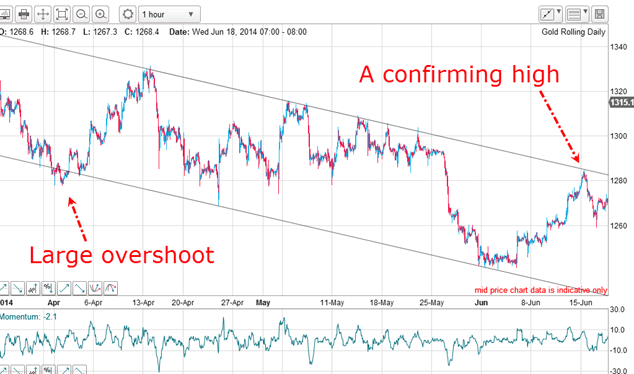
This was the hourly chart on Wednesday:

Because the latest high was made just above the $1,280 level, I readjusted the original tramline position, and now I have a multitude of very accurate touch points on the upper tramline. That is much better. The latest high confirmed this is the best tramline placement.
But on the negative side, I now have a large overshoot on the lower tramline, balanced by the two very accurate touch points. I do not like to see such a feature because it detracts from the confidence I have that the line is a solid line of support.
Now that I have confidence in my upper tramline as a line of resistance, I can confidently forecast that if the market manages to rally above this tramline and above the Wednesday high, it would very probably set off a mass of buy-stops placed there by the bears, who had been attracted to the short side based on the move down off the late May wedge (see previous articles).
How to trade a classic bear trap
But that has been a classic bear trap.
On Wednesday, I showed how to enter a long trade near the low to anticipate such a development.
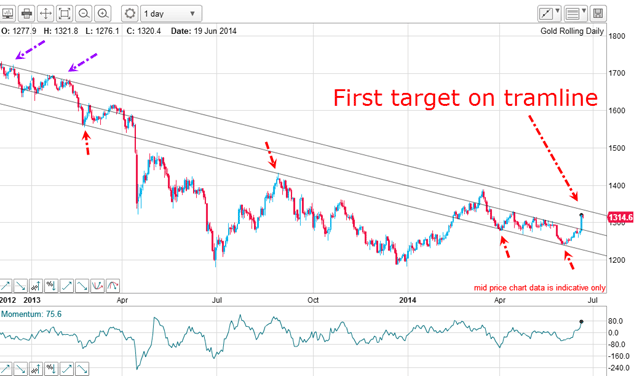
This is the chart this morning which shows what happens when a fuse is lit:

The $40 rally yesterday certainly took out a mountain of shorts. And according to my tramline trading rule, a long trade could be initiated on the tramline break using a buy-stop order.
Recall that my longer-term forecast has been for this substantial rally which would correct the huge declines to the double bottom at the $1,180 level back in December. I wrote on 2 June, when the market was bumping along the $1,240 level:
"But both groups of specs remain net long, and my guess is that before this down move ends, there will be a further swing by the specs to the bearish side. And that will provide the fuel for the massive rally that I expect"
How high will this E wave carry?

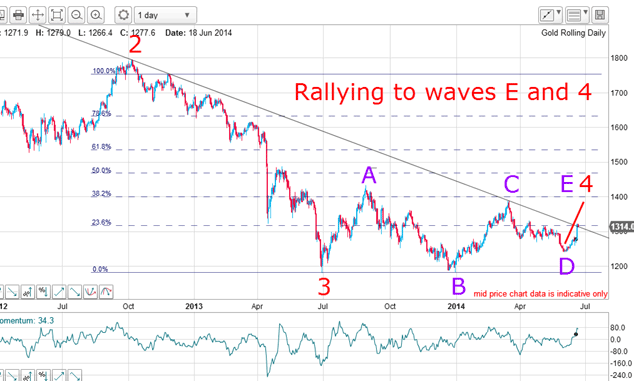
With the D wave low in place, we are currently in wave E within the large wave 4. This is exactly the way I had forecast a few months ago.
Now, with the market at the $1,320 area, it is bumping up against the major down trend line I have drawn off the wave 2 high back in October 2012.
Of course, the big question is how high will this E wave carry? Judging by the size of the other letter waves, it should have further to carry and then my $1,400 target really comes into play (it lies on the Fibonacci38% level, please note).
This could turn out to be a much bigger rally
Let's say the December $1,180 low is the start of an impulsive five-wave pattern. Is there any evidence that could support this view? If we do get such a pattern, it should carry well above the $1,600 level.

The rally to the almost-hit $1,400 high in March is wave 1 up. The three-wave A-B-C decline to the $1,240 low is my wave 2, and we could currently be in wave 3 up. Certainly, yesterday's sharp move has all the hallmarks of a minor third wave, because these are long and strong (observe the high Xreading).
Wave 2 has a clear A-B-C corrective shape, and this implies a substantial rally to come.
If this pans out, my third upper tramline becomes a major target in the $1,600 - $1,700 zone.
But first, the market must poke well above my centre tramline to confirm.
What the silver market tells us

With the market now entering resistance, upside progress should be a little more difficult, but I expect dips to be met with support.
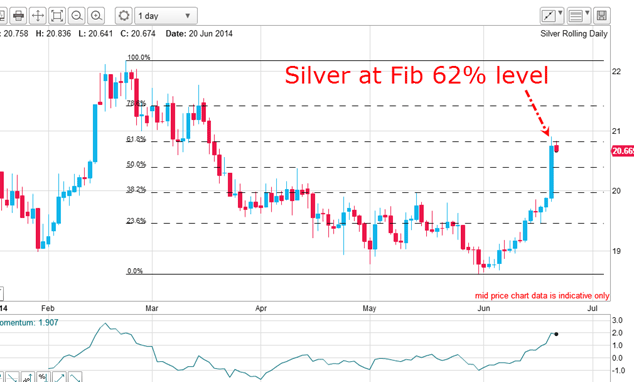
A related market is silver, which trades very much in synch with gold, and it has hit the important Fibonacci 62% level:

This is another reason why I expect stiff resistance for gold at the current $1,320 area. But a move above the $22 February high in silver should open the floodgates for both metals.
Get the latest financial news, insights and expert analysis from our award-winning MoneyWeek team, to help you understand what really matters when it comes to your finances.
John is is a British-born lapsed PhD physicist, who previously worked for Nasa on the Mars exploration team. He is a former commodity trading advisor with the US Commodities Futures Trading Commission, and worked in a boutique futures house in California in the 1980s.
He was a partner in one of the first futures newsletter advisory services, based in Washington DC, specialising in pork bellies and currencies. John is primarily a chart-reading trader, having cut his trading teeth in the days before PCs.
As well as his work in the financial world, he has launched, run and sold several 'real' businesses producing 'real' products.
-
 Average UK house price reaches £300,000 for first time, Halifax says
While the average house price has topped £300k, regional disparities still remain, Halifax finds.
-
 Barings Emerging Europe trust bounces back from Russia woes
Barings Emerging Europe trust has added the Middle East and Africa to its mandate, delivering a strong recovery, says Max King