The gold price hits my targets in the charts
Ignore all the talk about a surge in demand for gold coming from Russia and China, says John C Burford. Let the charts be your guide.
Get the latest financial news, insights and expert analysis from our award-winning MoneyWeek team, to help you understand what really matters when it comes to your finances.
You are now subscribed
Your newsletter sign-up was successful
Want to add more newsletters?

Twice daily
MoneyWeek
Get the latest financial news, insights and expert analysis from our award-winning MoneyWeek team, to help you understand what really matters when it comes to your finances.

Four times a week
Look After My Bills
Sign up to our free money-saving newsletter, filled with the latest news and expert advice to help you find the best tips and deals for managing your bills. Start saving today!
There is much talk about the current and future surge in demand for physical gold from Russia and China in particular. The obvious conclusion is that the price should rise in the absence of a corresponding surge in supply. Many gold pundits offer copious data backing up their bullish views.
But here's the thing: I have found over the years that there is little or no link between the supply and demand data and the gold price.
At first glance, that would seem to violate a fundamental law we learn in Economics 101. If basic supply and demand do not drive the gold price, then what does?
MoneyWeek
Subscribe to MoneyWeek today and get your first six magazine issues absolutely FREE

Sign up to Money Morning
Don't miss the latest investment and personal finances news, market analysis, plus money-saving tips with our free twice-daily newsletter
Don't miss the latest investment and personal finances news, market analysis, plus money-saving tips with our free twice-daily newsletter
As long-time readers will know, I maintain that it is trader sentiment that drives market prices and especially gold. A change in sentiment will produce a change in trend. Major highs and lows are always accompanied by extremes in sentiment. It's really that simple.
Gold is the ultimate sentiment market. Shares offer dividends and the prospect of future profits. Commodities have an end use and values that conform more or less to the supply-demand balance (unless the markets are manipulated).
Bonds also offer yield in the form of coupon payments and respond to changes in interest rates in the economy.
But gold has few uses outside of the roughly 10% of total demand for the electronic, industrial and dental sectors. Around 90% of demand is for jewellery and investment which are discretionary purchases and sales.
That is why I track sentiment data above all else.
How to set realistic profit-taking targets

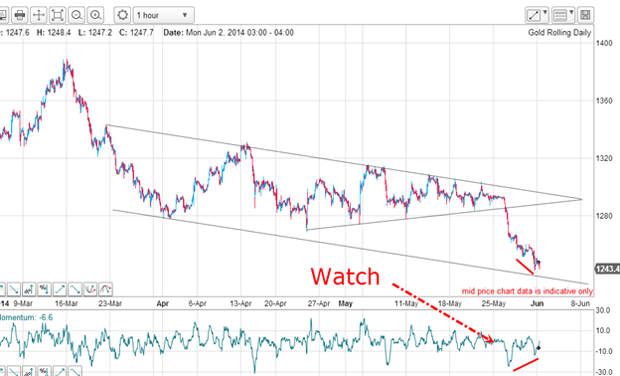
My target was on or around the lower tramline. Remember, I trusted my upper tramline, because of the multiple accurate touch points with only minor pigtails. This was a vital clue that my lower tramline drawn off the early April low was to be a significant line of support, despite it having only one touch point, so far.
My admonition to watch the budding positive-momentum divergence was timely and served to convince me to take profits there for a tidy gain of around $40 on a trade that lasted a week.
But my longer-term scenario called for a rally off a low in this region. This is what I wrote:"But both groups of specs remain net long, and my guess is that before this down move ends, there will be a further swing by the specs to the bearish side.
"And that will provide the fuel for the massive rally that I expect."
I noted that the specs had in the previous week added mightily to their short holdings, as revealed in the commitment of traders (COT) data.
The nervous gold market gives a solid buy signal
| (Contracts of 100 troy ounces) | Row 0 - Cell 1 | Row 0 - Cell 2 | Row 0 - Cell 3 | Open interest: 378,689 | ||||
| Commitments | ||||||||
| 159,567 | 98,440 | 26,148 | 156,553 | 219,703 | 342,268 | 344,291 | 36,421 | 34,398 |
| Changes from 06/03/14 (Change in open interest: -3,452) | ||||||||
| 2,235 | 259 | -2,258 | -2,992 | -3,286 | -3,015 | -5,285 | -437 | 1,833 |
| Percent of open in terest for each category of traders | ||||||||
| 42.1 | 26.0 | 6.9 | 41.3 | 58.0 | 90.4 | 90.9 | 9.6 | 9.1 |
| Number of traders in each category (Total traders: 260) | ||||||||
| 111 | 80 | 66 | 51 | 49 | 190 | 170 | Row 8 - Cell 7 | Row 8 - Cell 8 |
Really, there has been little change as the market fell during that week. No useful information there.
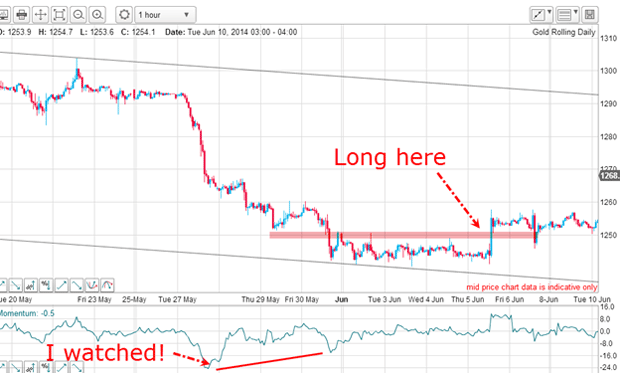
But last week, the market did stage a rebound and gave a solid buy signal:

There was a clear base forming along the lower tramline and I guessed that if the market could poke above the resistance of the pink zone, that would set the stage for a decent rally.
That placed me long in the $1,250 area with a protective stop just below the lows. Remember, a major factor going for me was the single-digit DSI (Daily Sentiment Index) bullish reading in late May.
And, as is typical with the nervous gold market, the market made another attempt at a new low, but the support held and it was off to the races towards my upper tramline. That event convinced me that the trend had reversed and the positive-momentum divergence was doing its work.
Why gold is a tricky market to trade

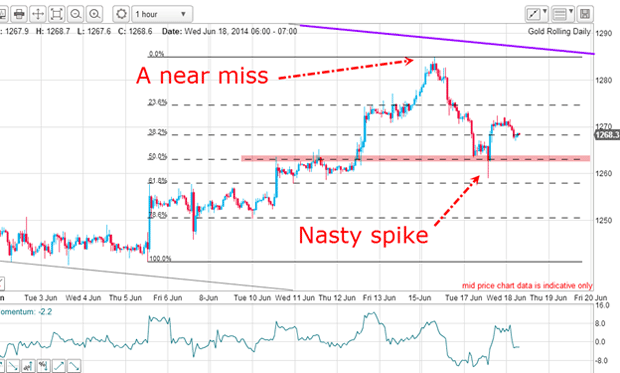
This rally carried to the $1,285 area a good $45 above the recent low. But it was getting perilously close to my upper tramline (in purple) and with a slight negative-momentum divergence there, it was time to take some profits off the table.
The decline off this high took the market to the Fibonacci 50% level (pink bar), which is a normal retracement before the rally resumes. But first, the market sprang another nasty surprise it spiked down and then quickly reversed. Legitimate long trades taken in the pink zone could have been annoyingly stopped out on that spike.
And if you were quite rightly waiting for the market to go long at the Fibonacci 62% level (the most common retracement), you would have missed out. The market never quite made it.
This is what makes gold a very tricky market to trade!
Which way will the market go?

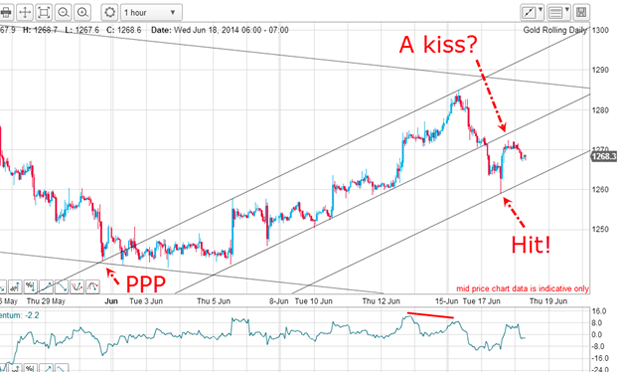
I certainly can! My upper tramline has a nice PPP (prior pivot point) and two accurate touch points, while my centre tramline has six accurate touch points, making it a very reliable line.
With these two tramlines, I can now draw a third lower tramline, and guess what? The nasty spike carried right to it before bouncing. Isn't that pretty?
Yesterday, the bounce almost carried to the centre tramline in a traditional kiss and is peeling away as I write.
Now the market is trading in the channel between the centre and lowest tramlines and will remain there until it breaks free but in which direction?
Meanwhile, I have taken good profits on the down move from late May and again on the recent rally. I will now let the market tell me what it wants to do as it traces out the next pattern. And I promise I will pay absolutely no heed to the reports of increased demand from Russia and China!
Get the latest financial news, insights and expert analysis from our award-winning MoneyWeek team, to help you understand what really matters when it comes to your finances.
John is is a British-born lapsed PhD physicist, who previously worked for Nasa on the Mars exploration team. He is a former commodity trading advisor with the US Commodities Futures Trading Commission, and worked in a boutique futures house in California in the 1980s.
He was a partner in one of the first futures newsletter advisory services, based in Washington DC, specialising in pork bellies and currencies. John is primarily a chart-reading trader, having cut his trading teeth in the days before PCs.
As well as his work in the financial world, he has launched, run and sold several 'real' businesses producing 'real' products.
-
 Average UK house price reaches £300,000 for first time, Halifax says
While the average house price has topped £300k, regional disparities still remain, Halifax finds.
-
 Barings Emerging Europe trust bounces back from Russia woes
Barings Emerging Europe trust has added the Middle East and Africa to its mandate, delivering a strong recovery, says Max King