My charts got the euro bounce just right, but the next target won’t be easy
Elliott wave theory and tramlines can give you an advantage over the herd, says John C Burford – as this latest trade in the euro proves.
Get the latest financial news, insights and expert analysis from our award-winning MoneyWeek team, to help you understand what really matters when it comes to your finances.
You are now subscribed
Your newsletter sign-up was successful
Want to add more newsletters?

Twice daily
MoneyWeek
Get the latest financial news, insights and expert analysis from our award-winning MoneyWeek team, to help you understand what really matters when it comes to your finances.

Four times a week
Look After My Bills
Sign up to our free money-saving newsletter, filled with the latest news and expert advice to help you find the best tips and deals for managing your bills. Start saving today!
Today I want to cover the euro, which has been following my roadmap very closely. My euro trade is yet another example of how the basic ideas from the Elliott wave theory correctly applied allow for the confident (and profitable) prediction of trend changes.
I don't know of any other method of technical analysis that can consistently do that for you.
My system perfectly predicted a euro bounce the herd did not
MoneyWeek
Subscribe to MoneyWeek today and get your first six magazine issues absolutely FREE

Sign up to Money Morning
Don't miss the latest investment and personal finances news, market analysis, plus money-saving tips with our free twice-daily newsletter
Don't miss the latest investment and personal finances news, market analysis, plus money-saving tips with our free twice-daily newsletter

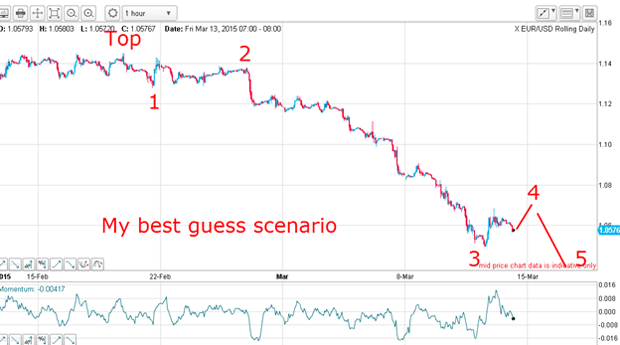
Remember, my long-range target was in the 1.04 1.05 zone (see my Trader postof 6 March: "Two indicators are telling me the euro will bounce at 1.05"). That's where I expected the final wave 5 to end, and a huge rally phase to begin.
Of course, this was very much against conventional thinking. But when the headlines in the mainstream media were all shouting that the euro was going to hit parity with the dollar and beyond it was clear to me that the end was nigh for the euro bears.
You will never see a headline such as "Dollar about to top out" while the market remains in a huge bull dollar move. Financial journalists and most so-called gurus do not get paid for correctly forecasting major turns with precise price levels or even time scales. But that does not mean such material is useless for a trader, as I have shown in these posts.
Most gurus and journalists are herd-followers, as are most traders. If the herd is ultra-bearish, the gurus and commentators will be too; that's what sells papers. It is important for traders to understand that.
Hedge funds are also mainly trend-followers and are especially prone to moving with the herd. That is fine so long as the trend doesn't change, but when it does, that's when the fireworks are let off.
A look at the latest commitments of traders (COT) data will show exactly what I'm talking about. Hedge funds (non-commercials) have been running a large plurality of shorts over longs for many months as the euro market established a firm bearish trend.
| CONTRACTS OF EUR 125,000 | Row 0 - Cell 1 | Row 0 - Cell 2 | Row 0 - Cell 3 | Open interest: 449,508 | ||||
| Commitments | ||||||||
| 56,329 | 250,103 | 7,806 | 348,754 | 101,065 | 412,889 | 358,974 | 36,619 | 90,534 |
| Changes from 10/3/15 (Change in open interest: -46,957) | ||||||||
| -4,942 | 7,759 | -17,385 | -20,896 | -35,105 | -45,223 | -44,731 | -3,734 | -2,226 |
| Percent of open interest for each category of traders | ||||||||
| 12.5 | 55.6 | 1.7 | 77.6 | 22.5 | 91.9 | 79.9 | 8.1 | 20.1 |
| Number of traders in each category (Total traders: 191) | ||||||||
| 49 | 103 | 30 | 48 | 57 | 112 | 176 | Row 8 - Cell 7 | Row 8 - Cell 8 |
As the market declined to the 1.05 area last Tuesday, the hedgies had increased their shorts/reduced their longs in anticipation of a bearish Fed report the next day; shorts outnumbered longs by almost five to one. That is extreme by any standard. Small traders were also bearish, almost three-to-one short.
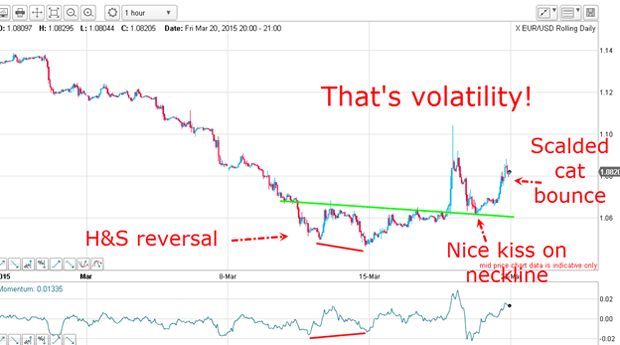
So what happened? Following the Fed report, the market took off like a scalded cat and trapped the shorts. I did not get the higher wave 4 I had predicted, but the market did dip into a new wave 5 low at 1.0460 on Friday 13 March and on a nice positive-momentum divergence (red bars).

But look what happened on Wednesday evening a mammoth rally sent the market up to well over 1.10, which was a gain of almost 600 pips off the low.
What a kick-off to the short squeeze I was looking for!
With that action, I felt justified in labelling the head and shoulders pattern with the neckline shown in green.
On Thursday, the market retreated back to the neckline, kissed it a great opportunity to cover all shorts and go long and took off on Friday in a scalded-cat bounce (this is a trademark pattern I look for after a kiss).
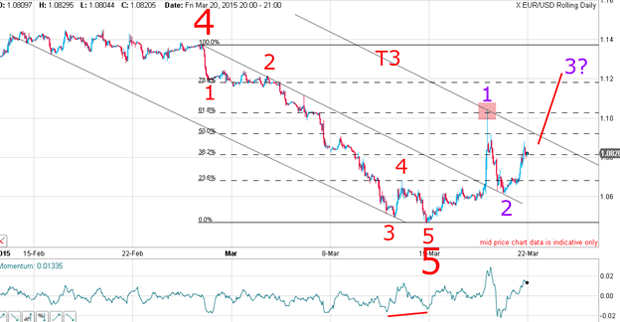
I want a little more information, so I'm going to look at the picture using my own trading system: Fibonacci, tramlines and Elliott waves.
My tramlines marked the euro downturn to the pip

That combination always means heavy resistance, and so it proved. What a perfectly textbook example of my methods!
Very short-term traders could have used this knowledge and taken profits near the high if they were watching the Fibs and tramlines, that is.
Incidentally, when you become a member of the Trade for Profit Academy, I will give you a good grounding in all of these techniques.
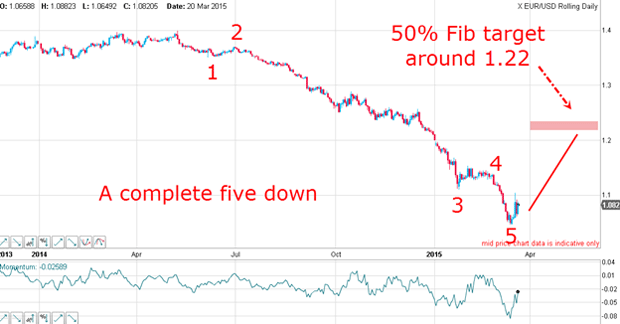
Anyway, let's look at the big picture and apply my model on a larger scale.
I've set a bullish euro target, but the path won't be smooth

You can be sure that when the rally does finally top out, the headlines will be screaming "Dollar is heading for complete collapse as it freefalls", or even "Dollar is worthless junk, say traders". Even today, when the dollar has rallied by over 20% in a few months, I still read articles proclaiming the death of the dollar, as if we are still in 2012-2014.
That is when bearish dollar sentiment will be in single figures and the COT data will be reversed.
That is how markets work. And that's how we make our money.
Get the latest financial news, insights and expert analysis from our award-winning MoneyWeek team, to help you understand what really matters when it comes to your finances.
John is is a British-born lapsed PhD physicist, who previously worked for Nasa on the Mars exploration team. He is a former commodity trading advisor with the US Commodities Futures Trading Commission, and worked in a boutique futures house in California in the 1980s.
He was a partner in one of the first futures newsletter advisory services, based in Washington DC, specialising in pork bellies and currencies. John is primarily a chart-reading trader, having cut his trading teeth in the days before PCs.
As well as his work in the financial world, he has launched, run and sold several 'real' businesses producing 'real' products.
-
 ISA fund and trust picks for every type of investor – which could work for you?
Whether you’re an ISA investor seeking reliable returns, looking to add a bit more risk to your portfolio or are new to investing, MoneyWeek asked the experts for funds and investment trusts you could consider in 2026
-
 The most popular fund sectors of 2025 as investor outflows continue
It was another difficult year for fund inflows but there are signs that investors are returning to the financial markets