Mind the (Dow Jones) gap in the charts
Gaps in the market are so rare these days, they usually stand out as a significant trading signal. John C Burford explains why.
Get the latest financial news, insights and expert analysis from our award-winning MoneyWeek team, to help you understand what really matters when it comes to your finances.
You are now subscribed
Your newsletter sign-up was successful
Want to add more newsletters?

Twice daily
MoneyWeek
Get the latest financial news, insights and expert analysis from our award-winning MoneyWeek team, to help you understand what really matters when it comes to your finances.

Four times a week
Look After My Bills
Sign up to our free money-saving newsletter, filled with the latest news and expert advice to help you find the best tips and deals for managing your bills. Start saving today!
Yesterday's huge declines in global stock indexes have the pundits wondering if this is just a mere blip on the way to the all-but-assured new highs. This is the overwhelmingly complacent view that has dominated markets for a long time.
But I have a different take and it is based on an objective analysis of the charts, not the usual trend-following approach of most investors and economists.
Trend-followers have evidently not ever looked at a price chart. All of them show waves up and down, with highs and lows plainly marked. If trend-followers are to be believed, these waves would not exist! What an absurd belief system.
MoneyWeek
Subscribe to MoneyWeek today and get your first six magazine issues absolutely FREE

Sign up to Money Morning
Don't miss the latest investment and personal finances news, market analysis, plus money-saving tips with our free twice-daily newsletter
Don't miss the latest investment and personal finances news, market analysis, plus money-saving tips with our free twice-daily newsletter
Why gaps are a significant trading signal
In the days before 24-hour computerised trading, gaps were a frequent occurrence on the charts of equities and indexes. There was a whole catalogue of different types listed in textbooks such as Edwards and Magee (the Bible' of its time).
But with almost continuous trading today, gaps are rare. In fact, they are so rare that they usually stand out as a significant trading signal.
The first gap in the Dow that I noted was that on 26 December the first trading day after the Christmas break. That was a gap up into a new all-time high when traders were encouraged by the Fed's steady as she goes' tapering plans.
The 2 January gap down off an all-time high came shortly after. I pointed out that if such a large gap, which was made at the end of a huge almost five year bull run, was not filled promptly, it would very likely lead to a rapid move away from it. This is called a breakaway gap.
The 26 December one can now be called an exhaustion gap because it occurred at the likely end of the big bull market off the 2009 low.
A terrific signal to position short
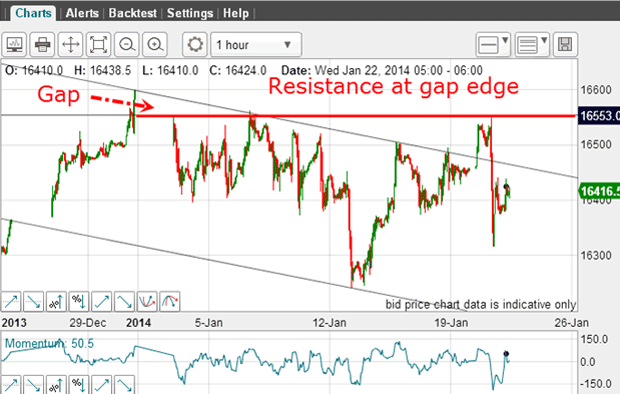
There were three attempts to close the gap, but all of them failed. The third time was certainly not lucky for the bulls, that is. And despite the barrage of good' economic news recently (UK car production is at a record level, for instance), the market has been in freefall away from the gap. What a terrific signal to position short!
Also last time I had my suggested Elliott wave 1-2 labels:
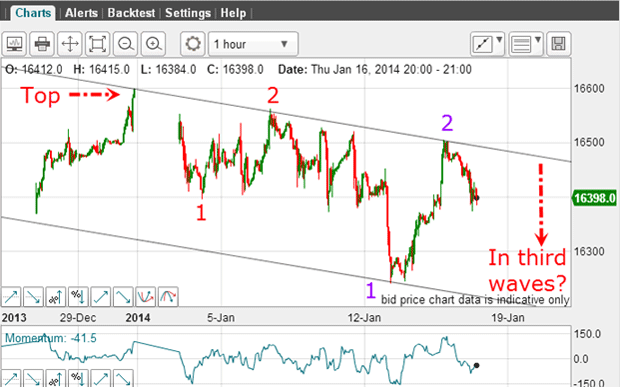
Note the second waves up are both deep retracements of their first waves down. This is entirely in keeping with the pattern over the past few years. And if these labels are correct, and we are at the start of a large third wave down, we should see a very swift collapse in third waves of several degrees of trend. This is a crucial observation.
Here is the chart this morning:
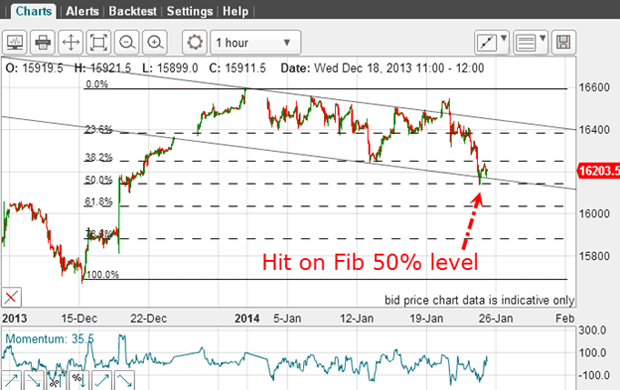
The market has dropped down to an accurate hit on the Fibonacci 50% level a common target. I also have a small overshoot of my lower tramline. This is a common event in a fast-moving market.
Now I believe I can have much more confidence in the Elliott waves that I posted last time. That's because of the price action yesterday, where the Dow lost almost 200 pips, and the 'fear index', the VIX, gained almost 10%. You can see this on the chart below:
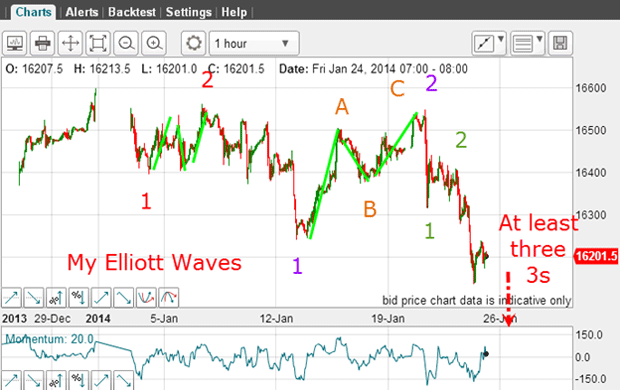
Note that my second waves are in the classic A-B-C form. Remember, an A-B-C always runs counter-trend. In the very short-term, the move off Tuesday's high is a classic 1-2-3, which is the main part of an impulsive five-wave pattern. The ongoing third wave is long and strong. The next confirming move would be a fourth wave and then a new low in wave 5. That is my roadmap until proven otherwise.
The bigger picture
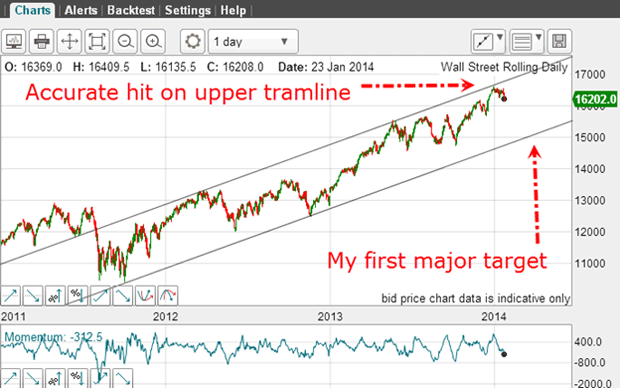
This is a chart I have showed several times previously. It shows the very accurate touch on my upper tramline. This is a tramline that has been operating for over two years. And my belief has always been that this line would remain a solid line of resistance and so it has proved.
That allows me to set my first major target at the lower tramline in the 15,000 area provided the trend has changed. And that appears much more likely now than it did last week.
I can even make a rough estimate of how swiftly my target is likely to be reached. With bullish sentiment sky-high, there have been very few bears willing to trade against the uptrend. This is evidenced by the recent COT (commitments of traders) data.
And it's especially true in the more speculative Nasdaq, which I have shown in recent posts. At one point the ratio of bulls to bears reached a staggering 12:1! This suggests there are very few old shorts out there to keep a brake on the declines by their short-covering.
Consequently, the decline to my target is likely to be swift, and it could be reached within a very few weeks.
Of course, we must keep in mind the possibility that the move down is not a series of 1-2s, but a large A-B-C, which implies a move to new highs. I place this at a much lower probability because of the sentiment position, which still believes (hopes?) that improvements in the economy will lead to ever-higher markets. We shall see.
This week's action is a warning for the mighty stock bull-market.
Get the latest financial news, insights and expert analysis from our award-winning MoneyWeek team, to help you understand what really matters when it comes to your finances.
John is is a British-born lapsed PhD physicist, who previously worked for Nasa on the Mars exploration team. He is a former commodity trading advisor with the US Commodities Futures Trading Commission, and worked in a boutique futures house in California in the 1980s.
He was a partner in one of the first futures newsletter advisory services, based in Washington DC, specialising in pork bellies and currencies. John is primarily a chart-reading trader, having cut his trading teeth in the days before PCs.
As well as his work in the financial world, he has launched, run and sold several 'real' businesses producing 'real' products.
-
 MoneyWeek Talks: The funds to choose in 2026
Podcast Fidelity's Tom Stevenson reveals his top three funds for 2026 for your ISA or self-invested personal pension
-
 Three companies with deep economic moats to buy now
Opinion An economic moat can underpin a company's future returns. Here, Imran Sattar, portfolio manager at Edinburgh Investment Trust, selects three stocks to buy now