Is this the end of the gold bear market?
Is gold gearing up for a big rally, or are the market's latest moves just a correction in the bear trend? John C Burford examines the charts.
Get the latest financial news, insights and expert analysis from our award-winning MoneyWeek team, to help you understand what really matters when it comes to your finances.
You are now subscribed
Your newsletter sign-up was successful
Want to add more newsletters?

Twice daily
MoneyWeek
Get the latest financial news, insights and expert analysis from our award-winning MoneyWeek team, to help you understand what really matters when it comes to your finances.

Four times a week
Look After My Bills
Sign up to our free money-saving newsletter, filled with the latest news and expert advice to help you find the best tips and deals for managing your bills. Start saving today!
With all the recent heavy action and excitement in stock markets, gold has been quietly gaining ground behind the scenes. Interest in gold remains very low, and has been for some time. And that is usually a great time for traders to focus on it and be contrarian traders.
When gold was challenging the critical $1,180 support zone earlier this month, bullish consensus had plumbed record depths of well under 10%. The COT (commitments of traders) figures also pointed to an abnormally low ratio of long/short futures held by the hedge funds who are the largest players.
Of course, this was fertile ground for bold traders wishing to trade against majority opinion, and they have been rewarded by a $70 rally off the $1,180 low, so far.
MoneyWeek
Subscribe to MoneyWeek today and get your first six magazine issues absolutely FREE

Sign up to Money Morning
Don't miss the latest investment and personal finances news, market analysis, plus money-saving tips with our free twice-daily newsletter
Don't miss the latest investment and personal finances news, market analysis, plus money-saving tips with our free twice-daily newsletter
The question is: is this the start of the huge rally that many gold bugs are forecasting? The gold bugs are forever loyal to the yellow metal even in strong bear markets - they are cracked records, are they not?
Or is it just a corrective move before the downtrend really gets into gear?
How long will the rally last?
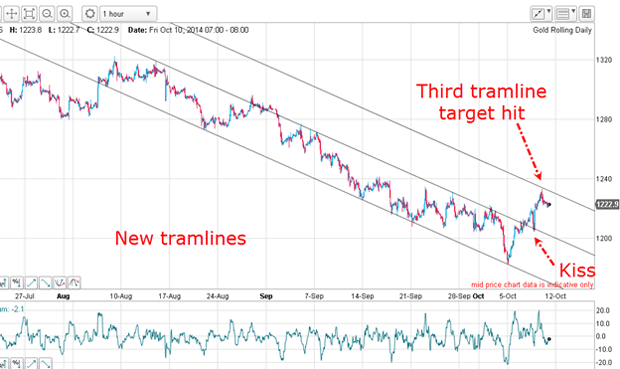
In my postof 10 October, I had new tramlines working on the hourly:

The move down off the August high was a clear five-wave move with the fifth and terminal wave low at the $1,180 level. The next move was very likely at least an A-B-C pattern of some size. Other options were possible, but the most likely is the A-B-C.
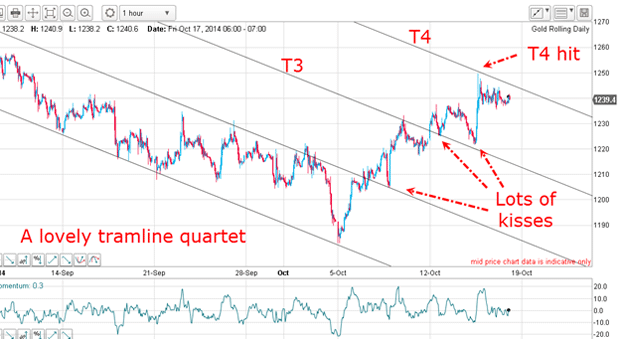
Updating this chart, I have more tramlines:

Last time, I had only three tramlines. But now with the upward break of that line I could draw my fourth tramline, which the market spiked up to on Wednesday at the $1,350 level. Isn't that pretty?
And there were lots of kisses along the way! When a tramline was broken, the market always came back to plant a kiss on that line before moving smartly up in a scalded-cat bounce. This is pure textbook behaviour.
You see, without the framework provided by my tramline construction, it was difficult to understand what was going on. But with the knowledge of how tramlines are drawn and the concept of the kiss and scalded-cat bounce, it was a straightforward task to follow the moves.
Now that T4 has been reached, is the rally over or is there still more in the tank?
How to use the charts to put a rally into perspective
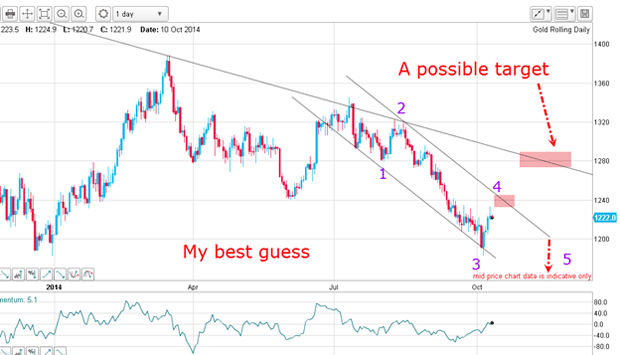
This is the time to put this rally into perspective on the daily chart. This was the chart I had last time:

The entire move off the July high is in a five-wave sequence and the long and strong wave 3 probably terminated at the $1,180 low. The current rally is therefore a corrective fourth wave up.
My first target was the upper tramline in the $1,340 area, and this was hit this week. This is what I wrote on 10 October: "I now have my third wave low and the market is now in the fourth wave. My first realistic target is on the upper tramline around $1,240". I have half of my best guess correctly forecast.
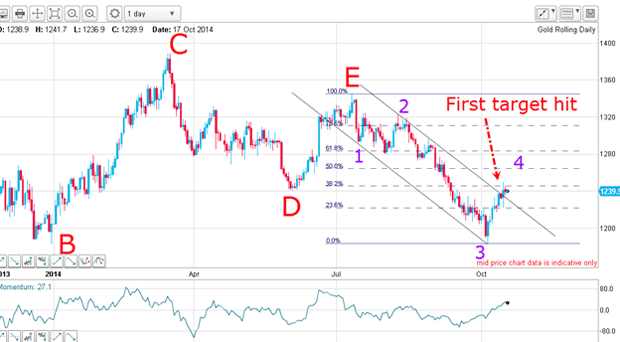
Here is the updated chart:

In addition, my upper tramline has been breached in that rally and it appears we have not yet seen the top of wave 4.
This $70 rally is much sharper (steeper slope) than the previous decline to the $1,180 low. That is entirely expected since the bullish consensus was so low. In fact, it is a classic short squeeze. I love those!
Also, the rally to $1,250 has taken it to the D wave low usually, a place of resistance. It may have trouble pushing up strongly from here, despite the tramline break.
Bulls still have a reason to worry
Looking at the bigger picture, while stocks have been battered with many indexes down by 10% or more in the past three weeks, gold has only managed a $70 rally. That must be worrying for the bulls.
The reason? Gold is battling between the bullish force of the flight to safety from stocks and the bearish force of a gathering global deflation. In a strong deflation, all assets will decline in value (including gold) and the dollar will get stronger.
We are already seeing signs of a strong flight to the US dollar and a de-risking of positions. I expect a choppy gold market for some time and a tough one to trade.
Get the latest financial news, insights and expert analysis from our award-winning MoneyWeek team, to help you understand what really matters when it comes to your finances.
John is is a British-born lapsed PhD physicist, who previously worked for Nasa on the Mars exploration team. He is a former commodity trading advisor with the US Commodities Futures Trading Commission, and worked in a boutique futures house in California in the 1980s.
He was a partner in one of the first futures newsletter advisory services, based in Washington DC, specialising in pork bellies and currencies. John is primarily a chart-reading trader, having cut his trading teeth in the days before PCs.
As well as his work in the financial world, he has launched, run and sold several 'real' businesses producing 'real' products.
-
 Average UK house price reaches £300,000 for first time, Halifax says
While the average house price has topped £300k, regional disparities still remain, Halifax finds.
-
 Barings Emerging Europe trust bounces back from Russia woes
Barings Emerging Europe trust has added the Middle East and Africa to its mandate, delivering a strong recovery, says Max King